Hedgwatch Portal
Scan markets in minutes and trade with a clear regime, bias, and scenario — not noise. Highly visual dashboards, cyclical projections, movers, and quant context in one workflow.
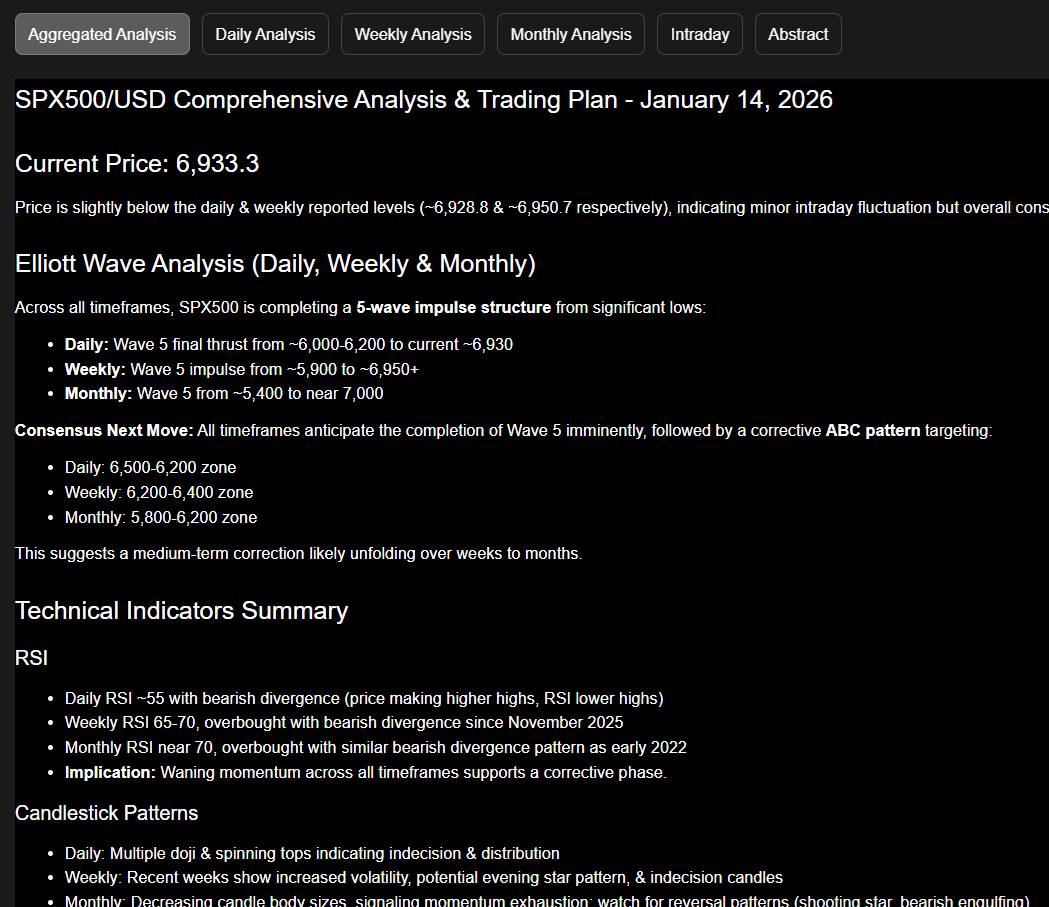
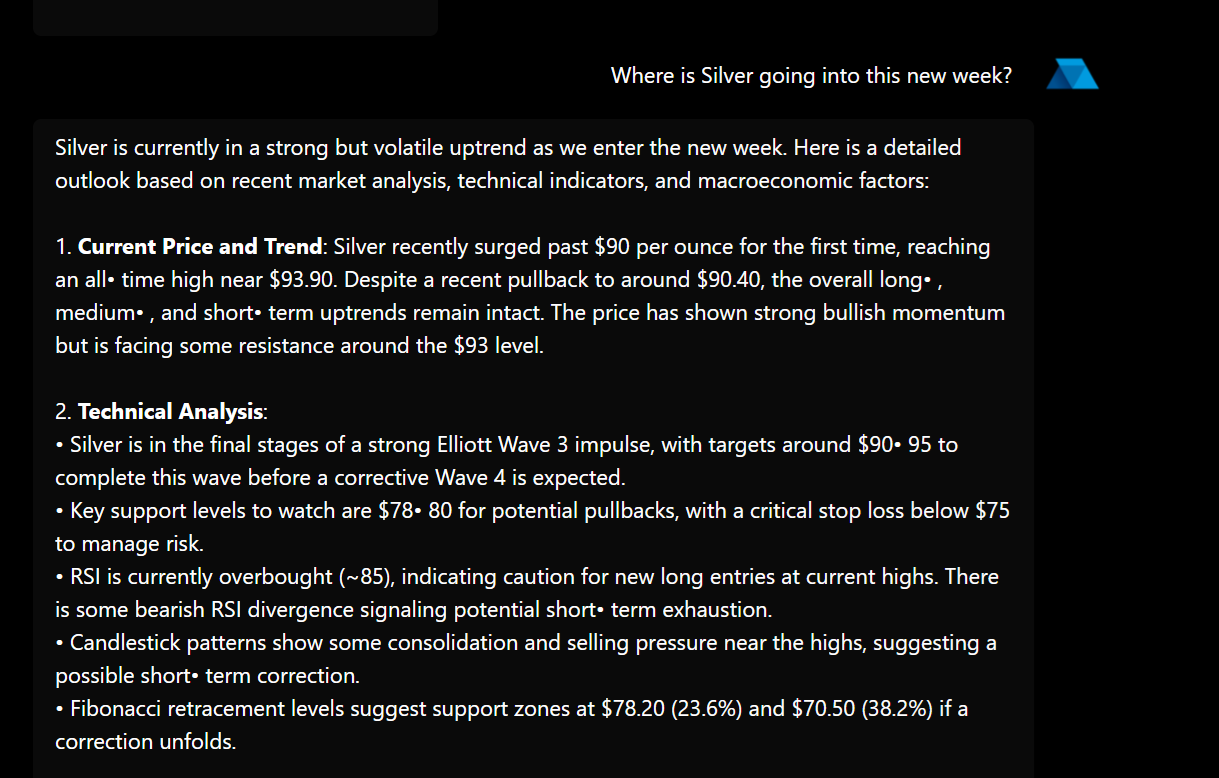
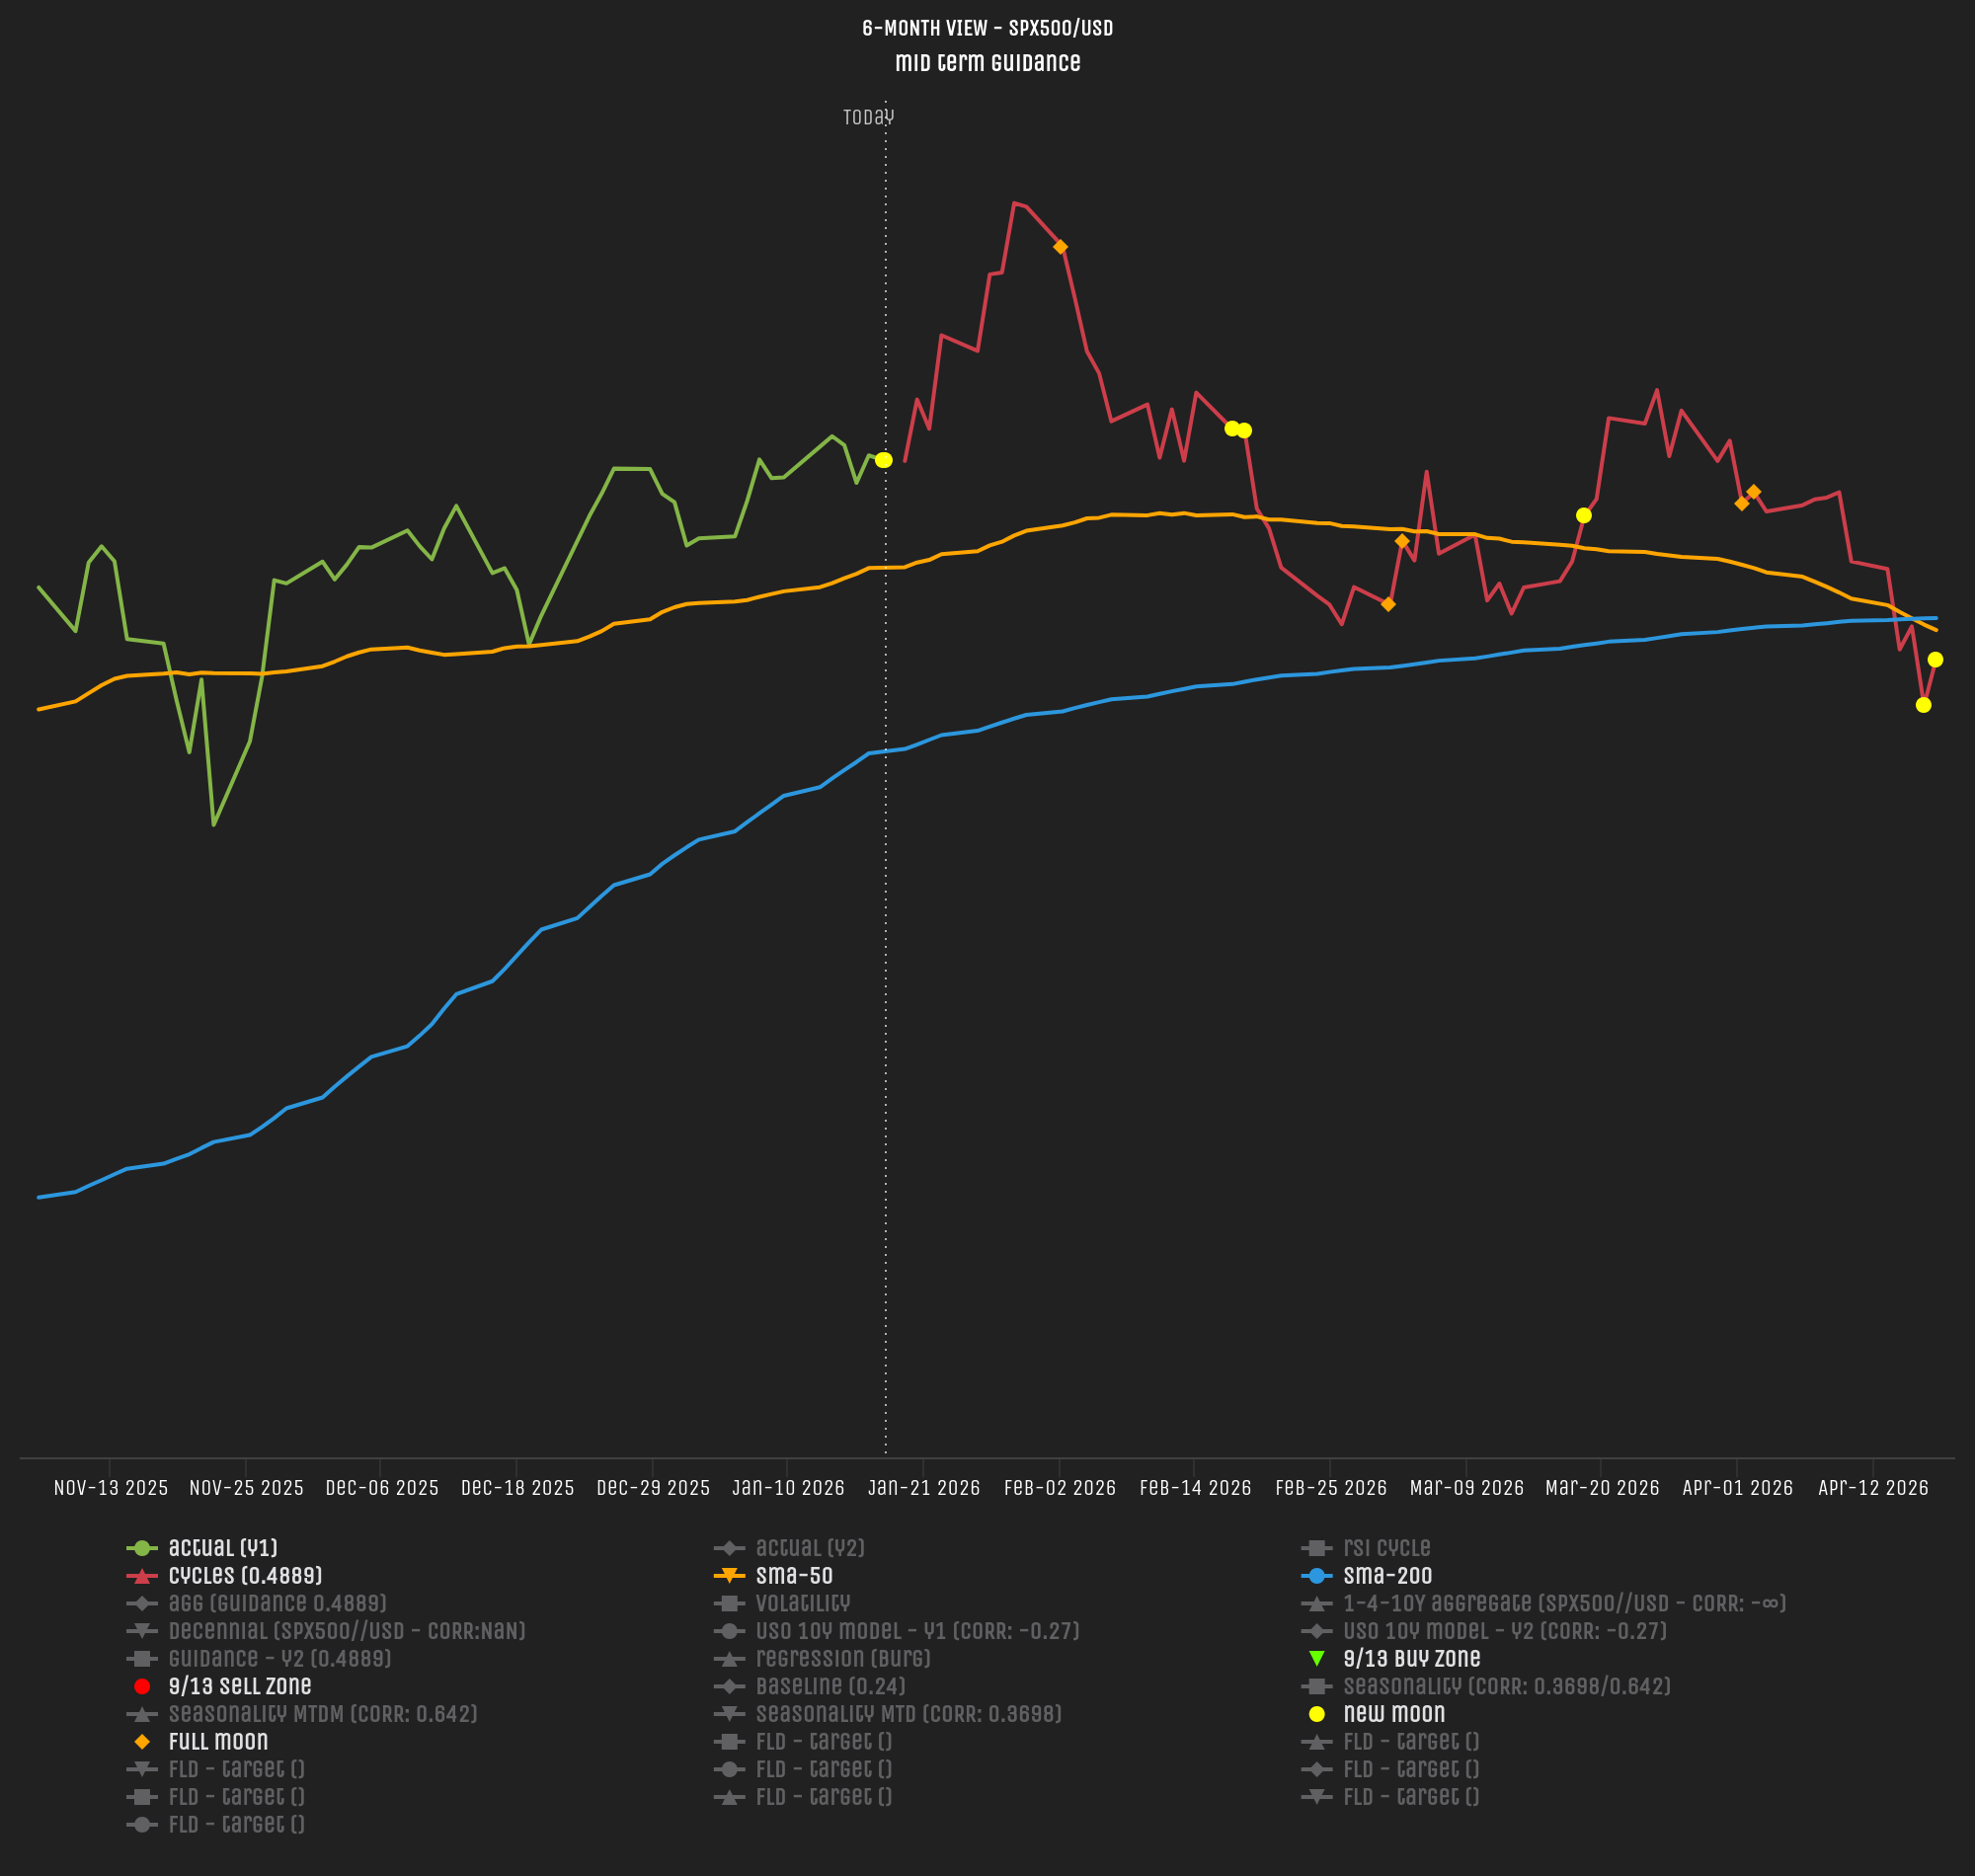
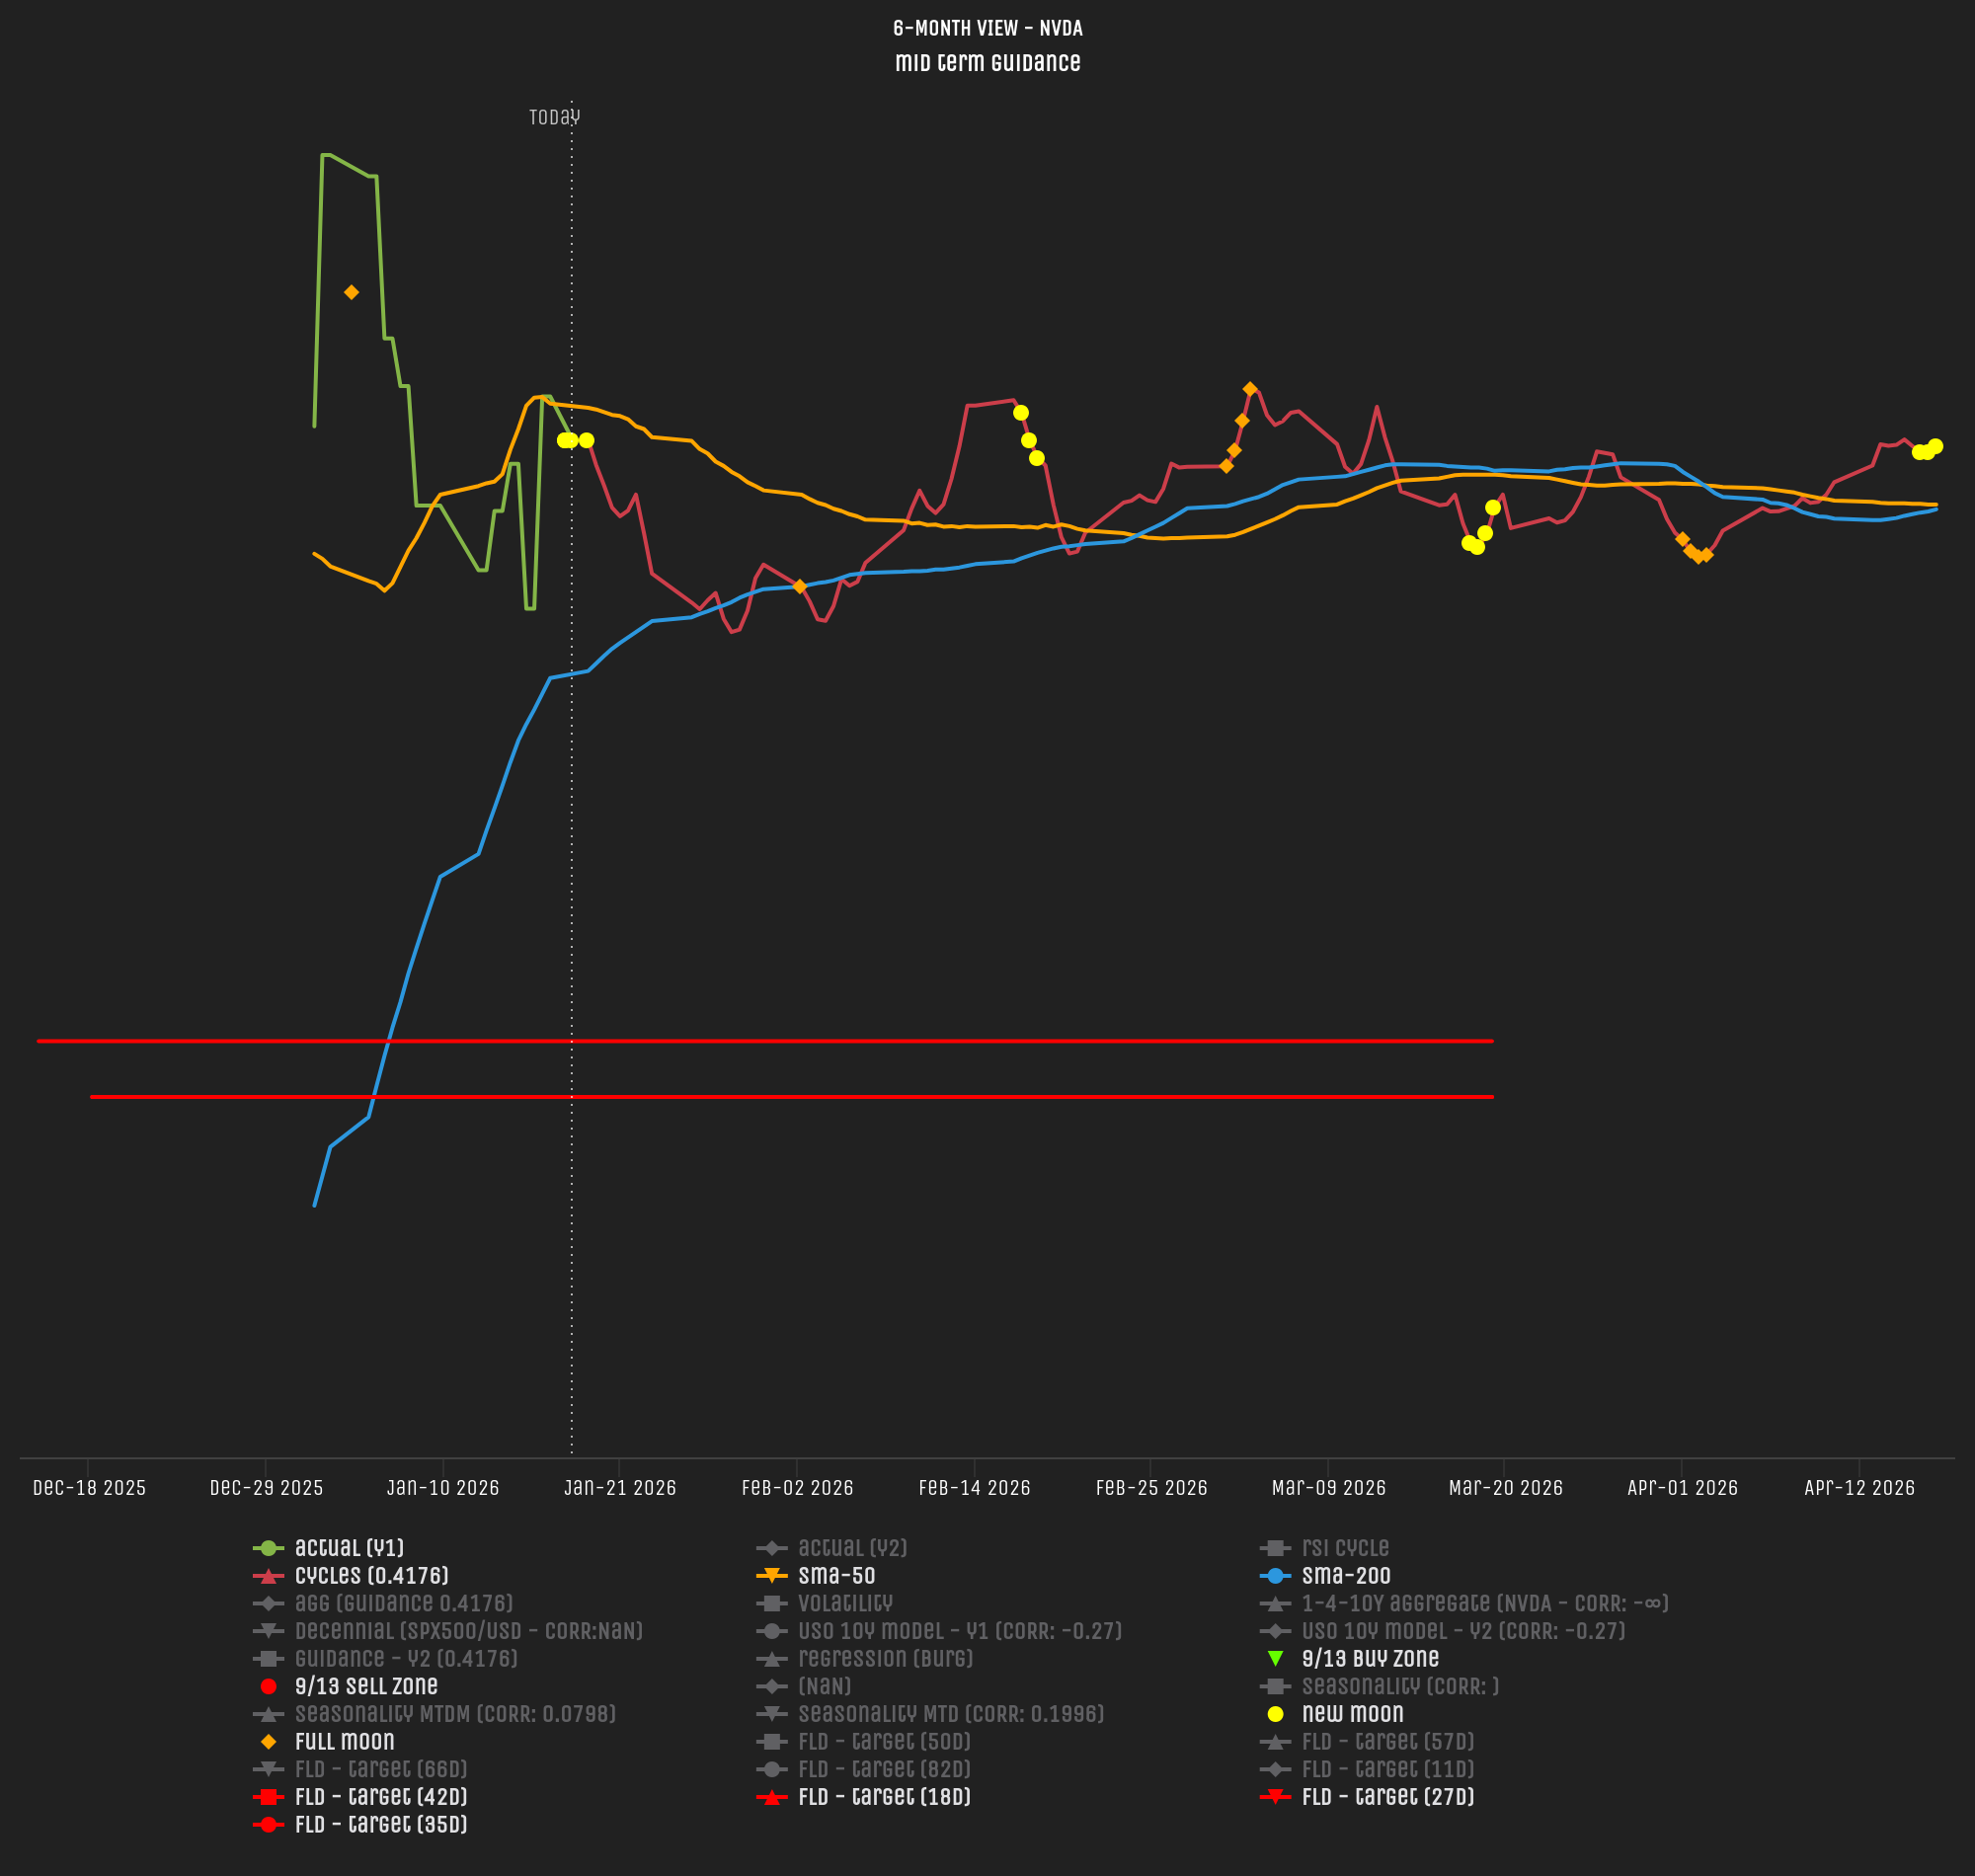
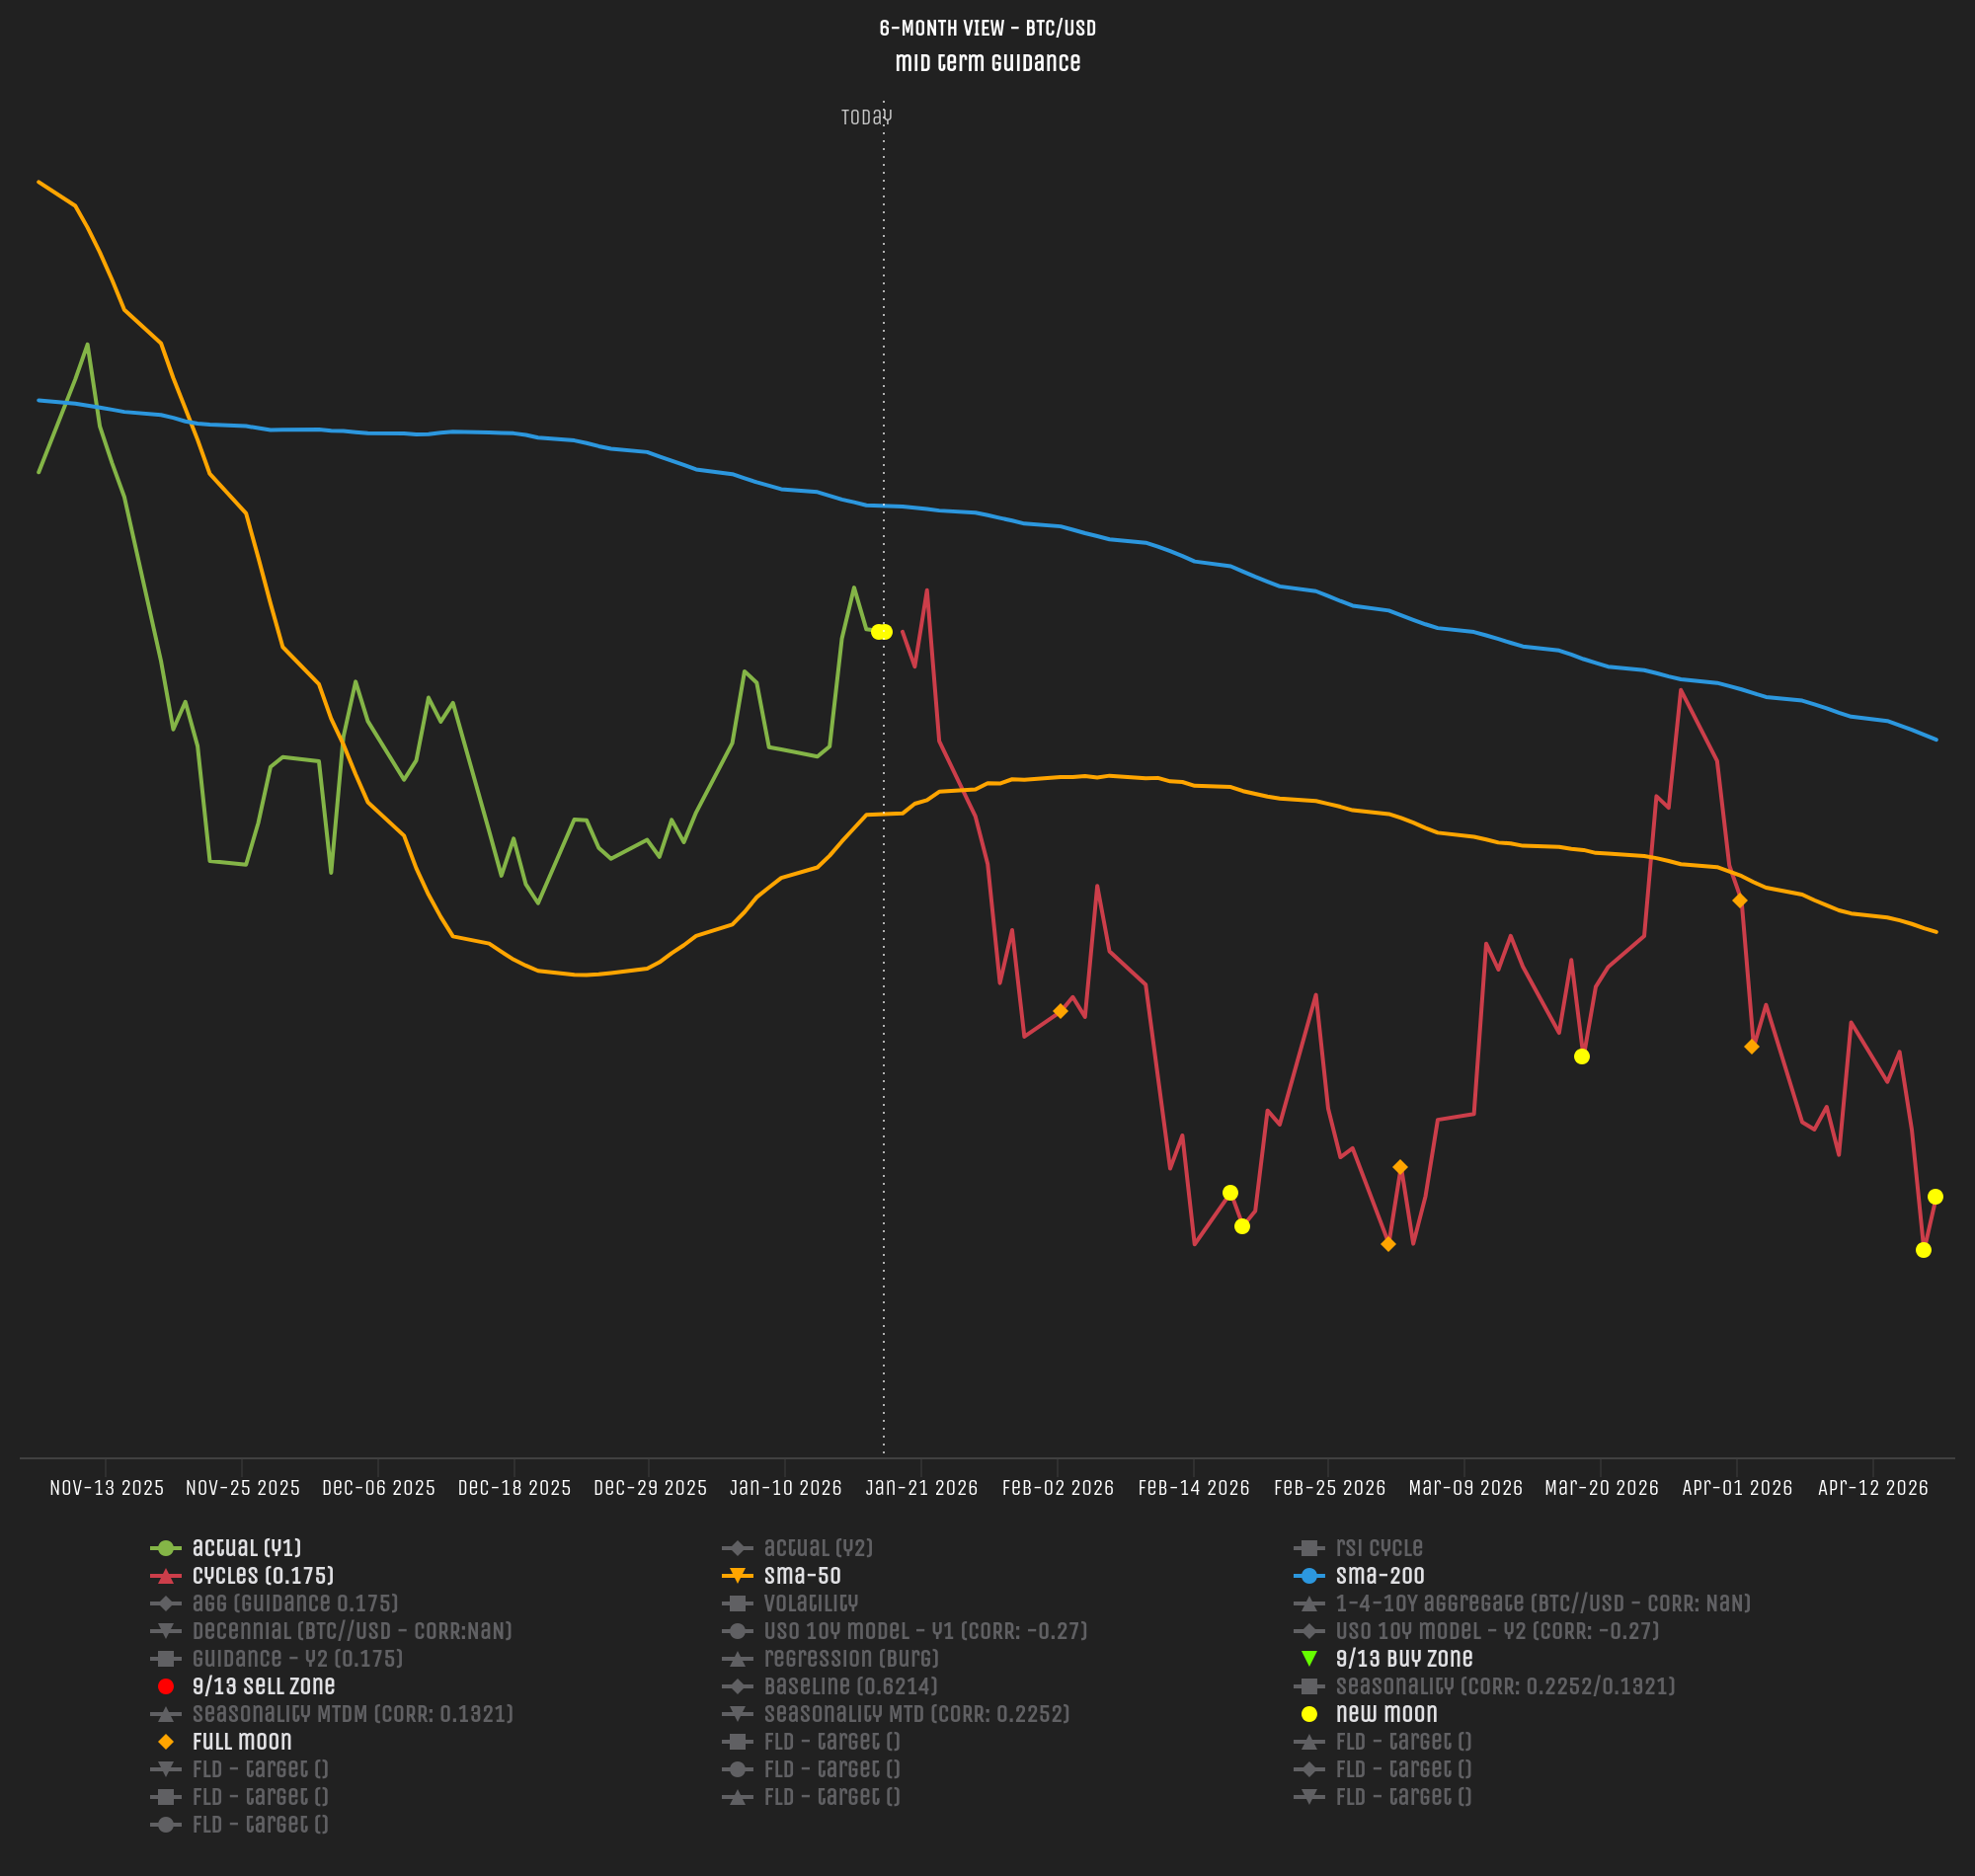
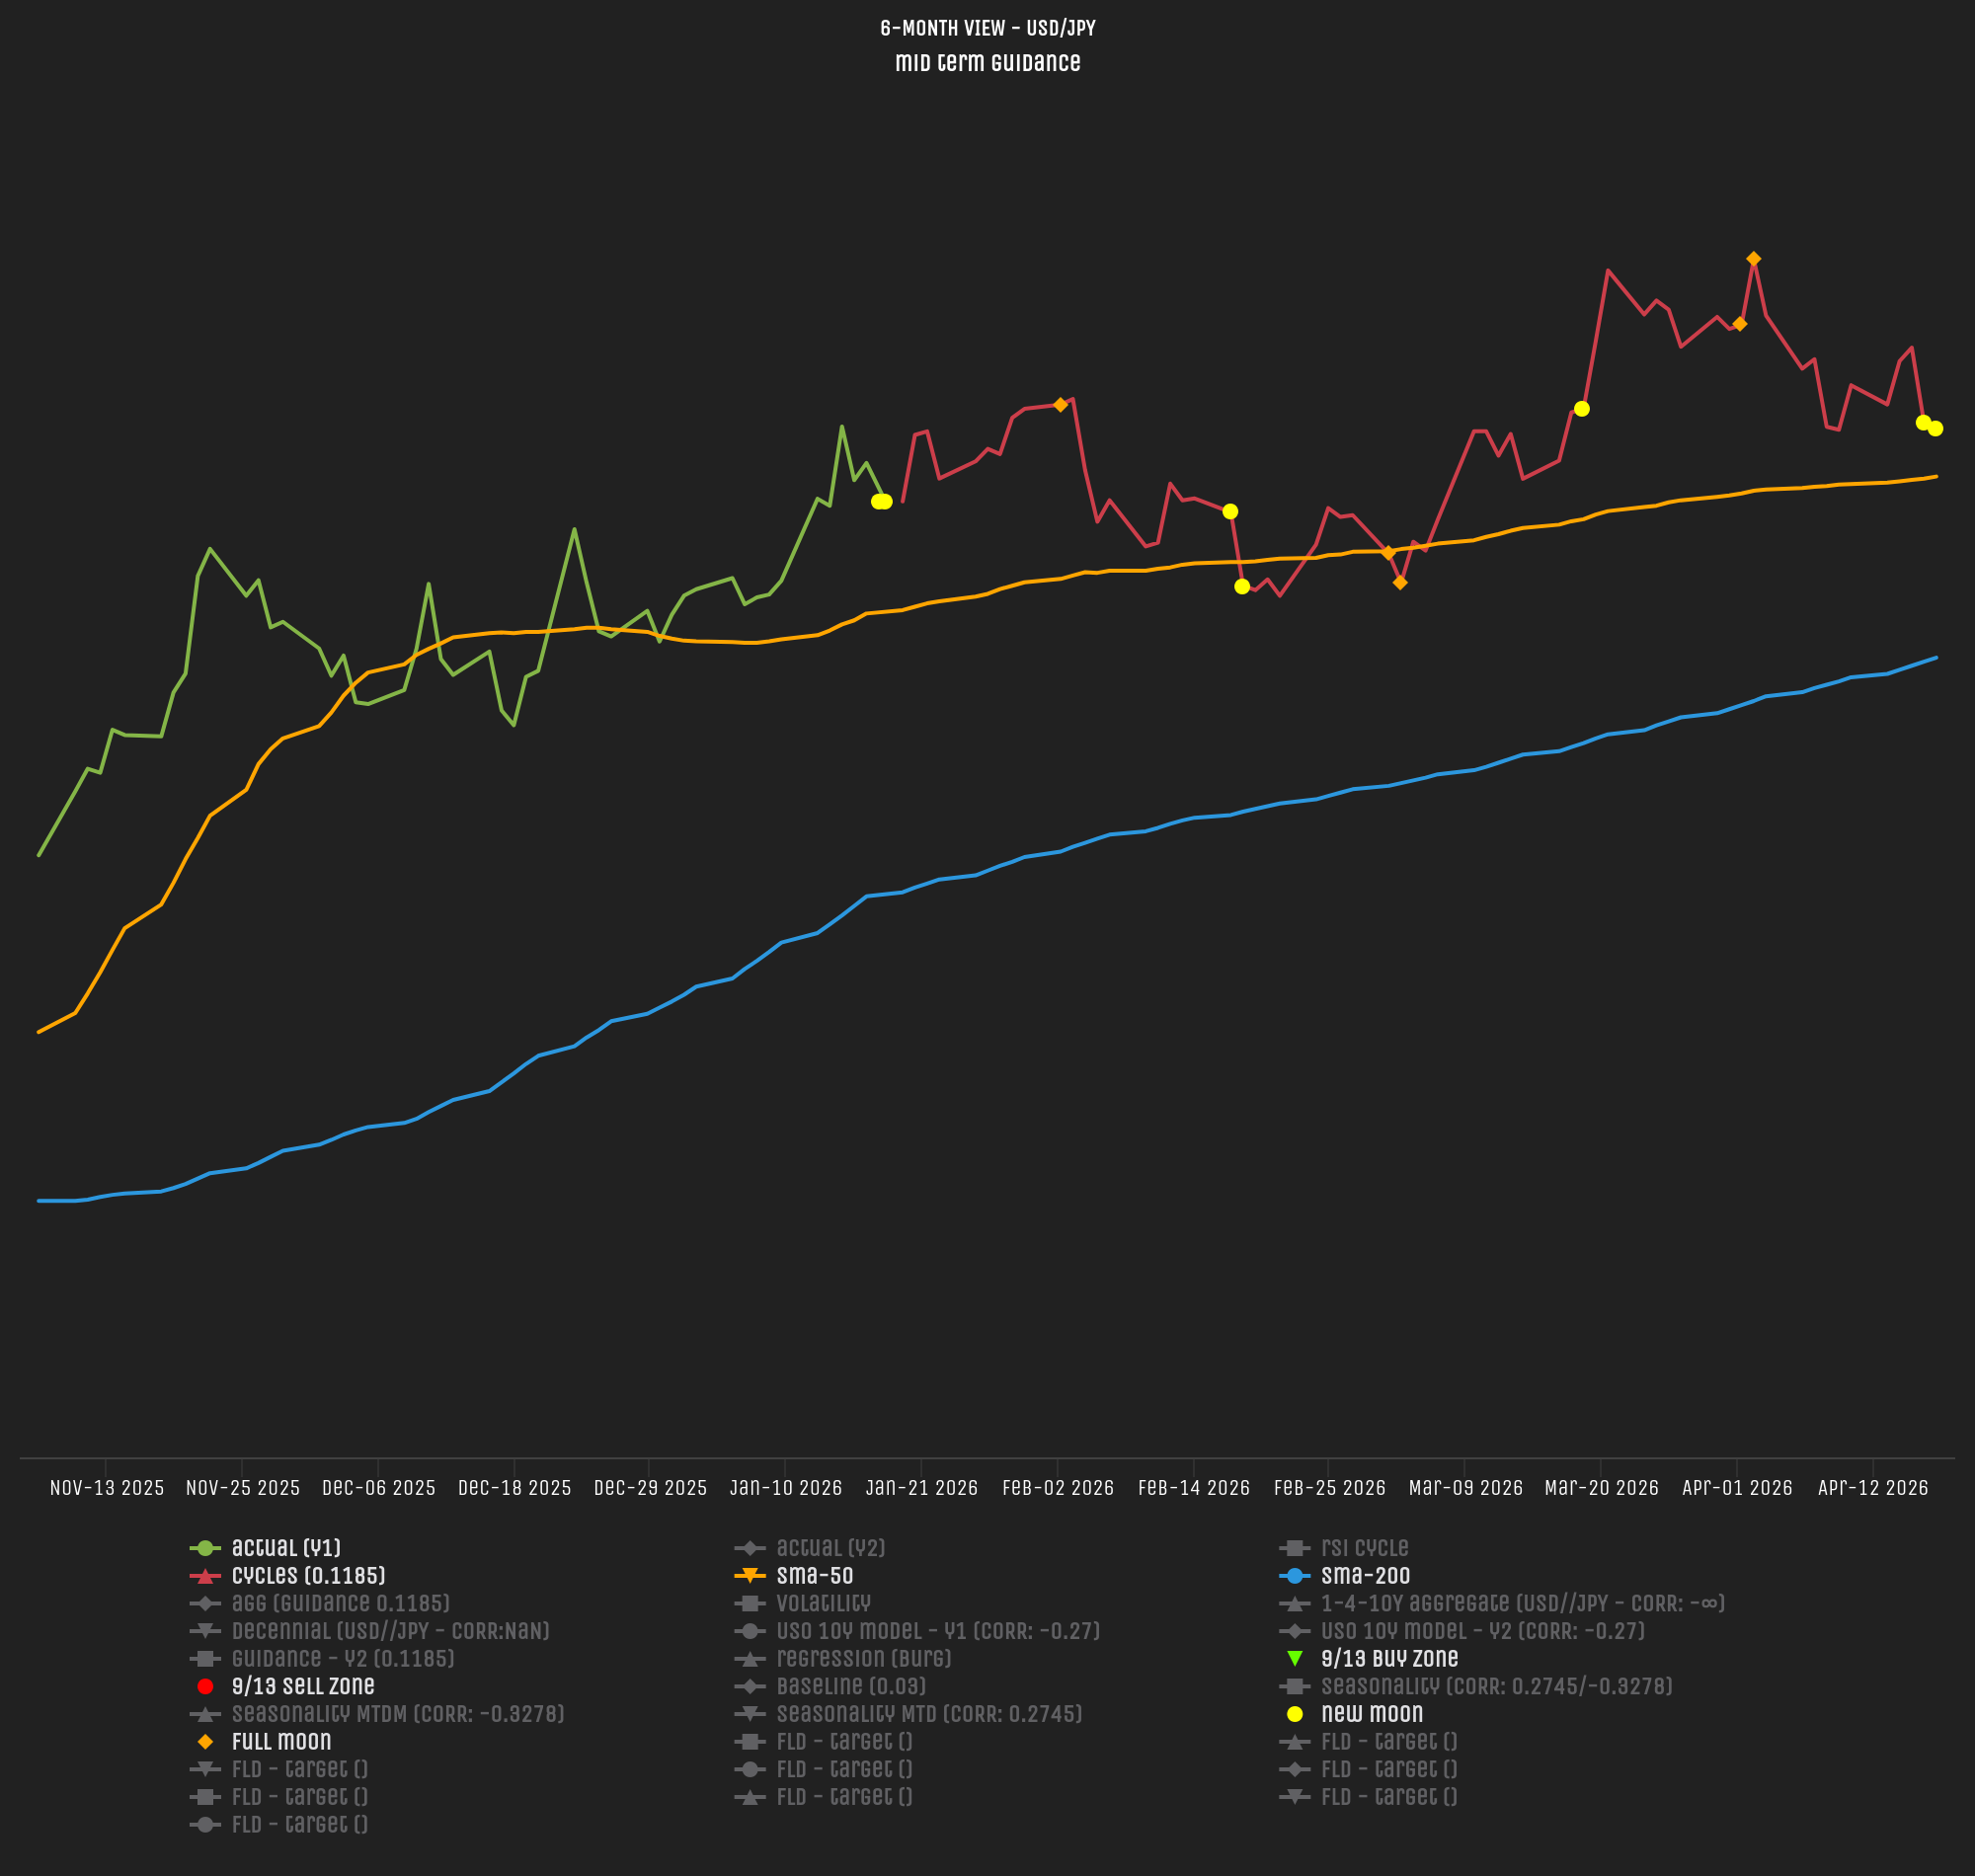
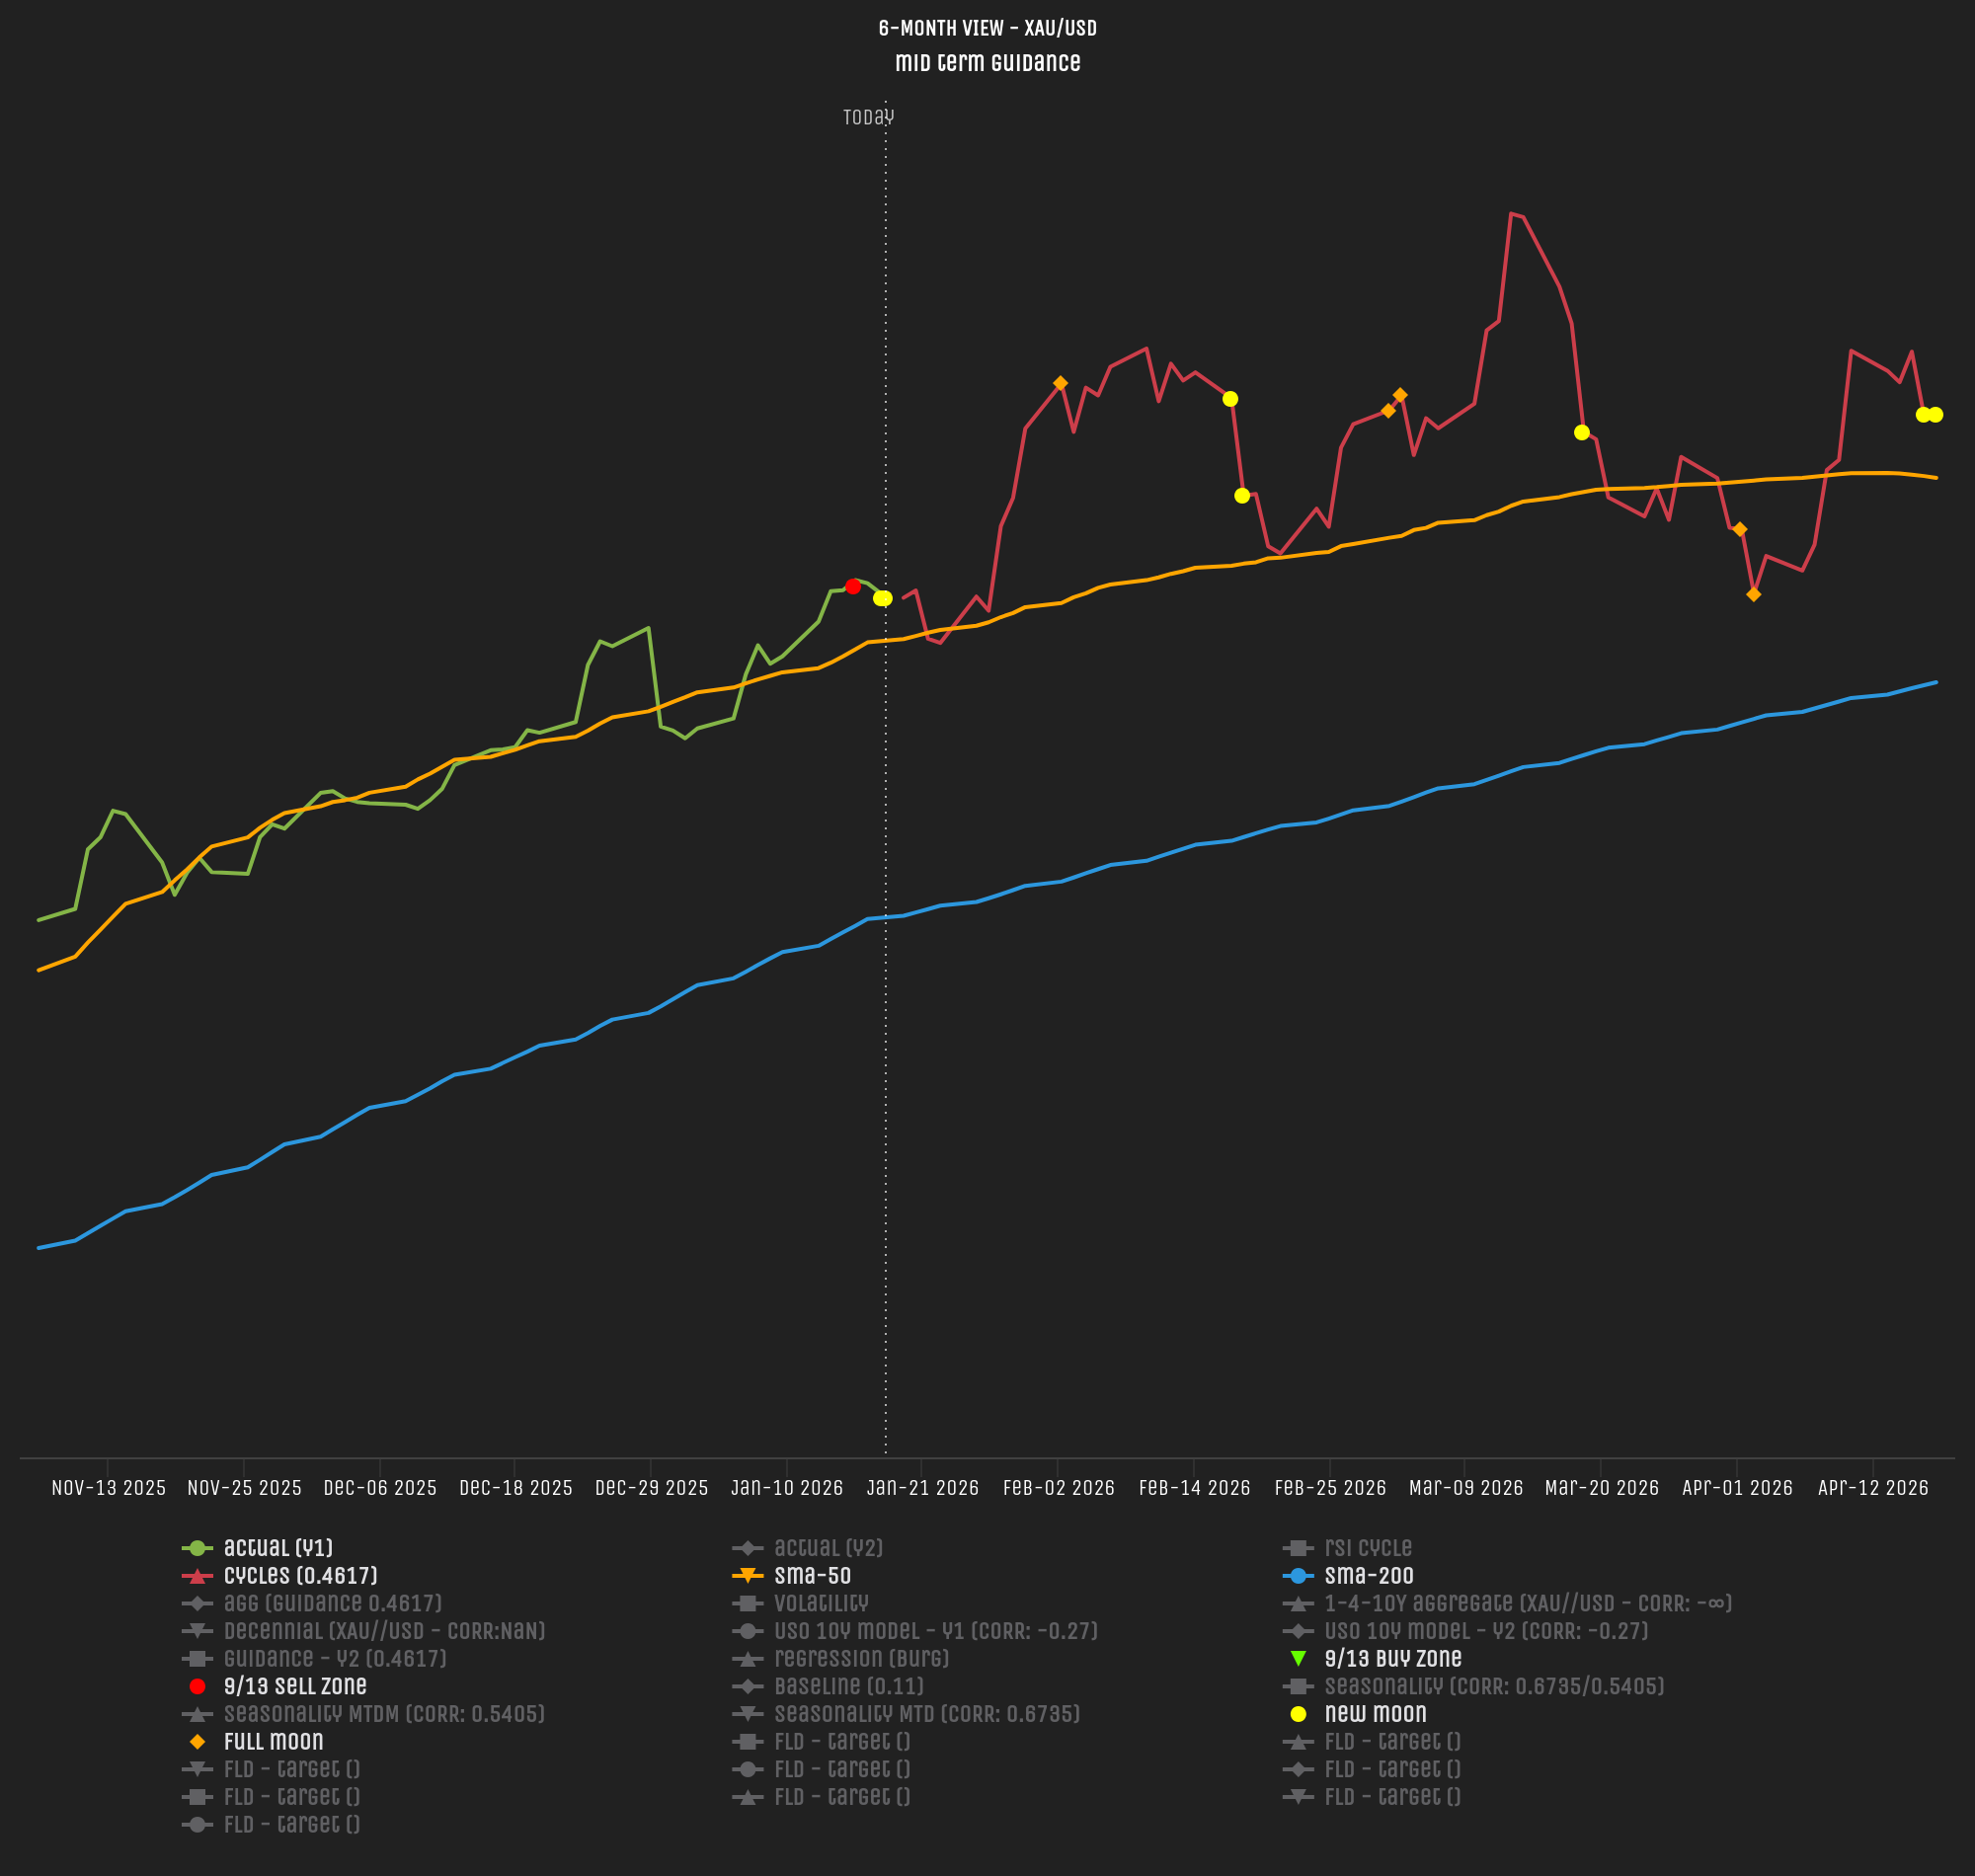
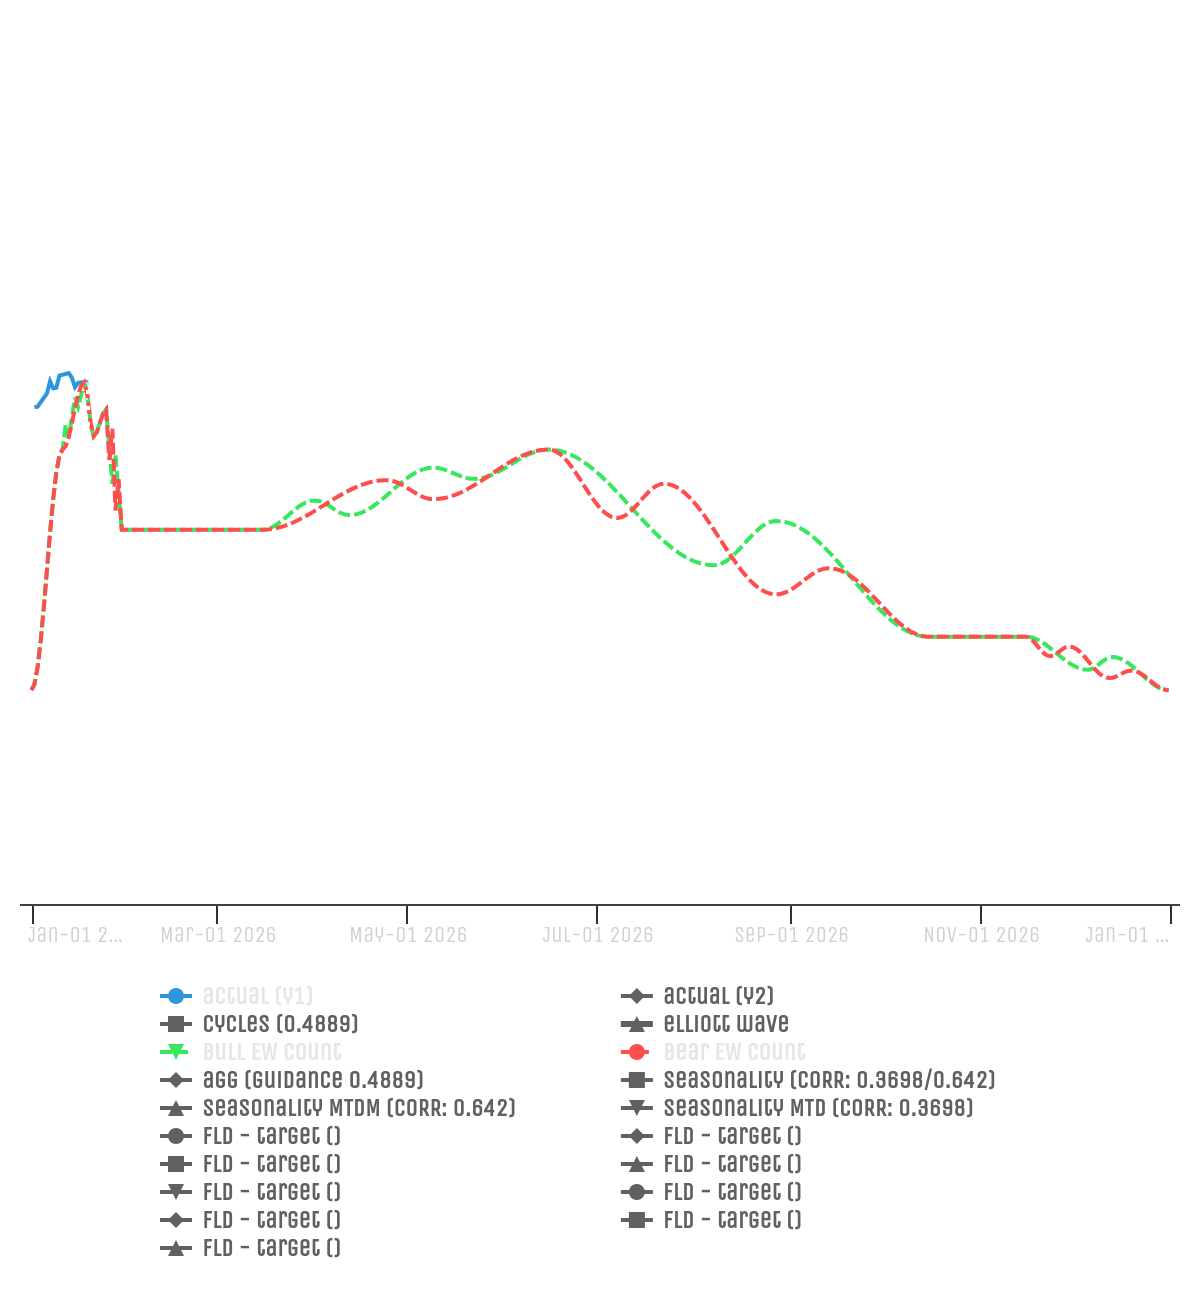
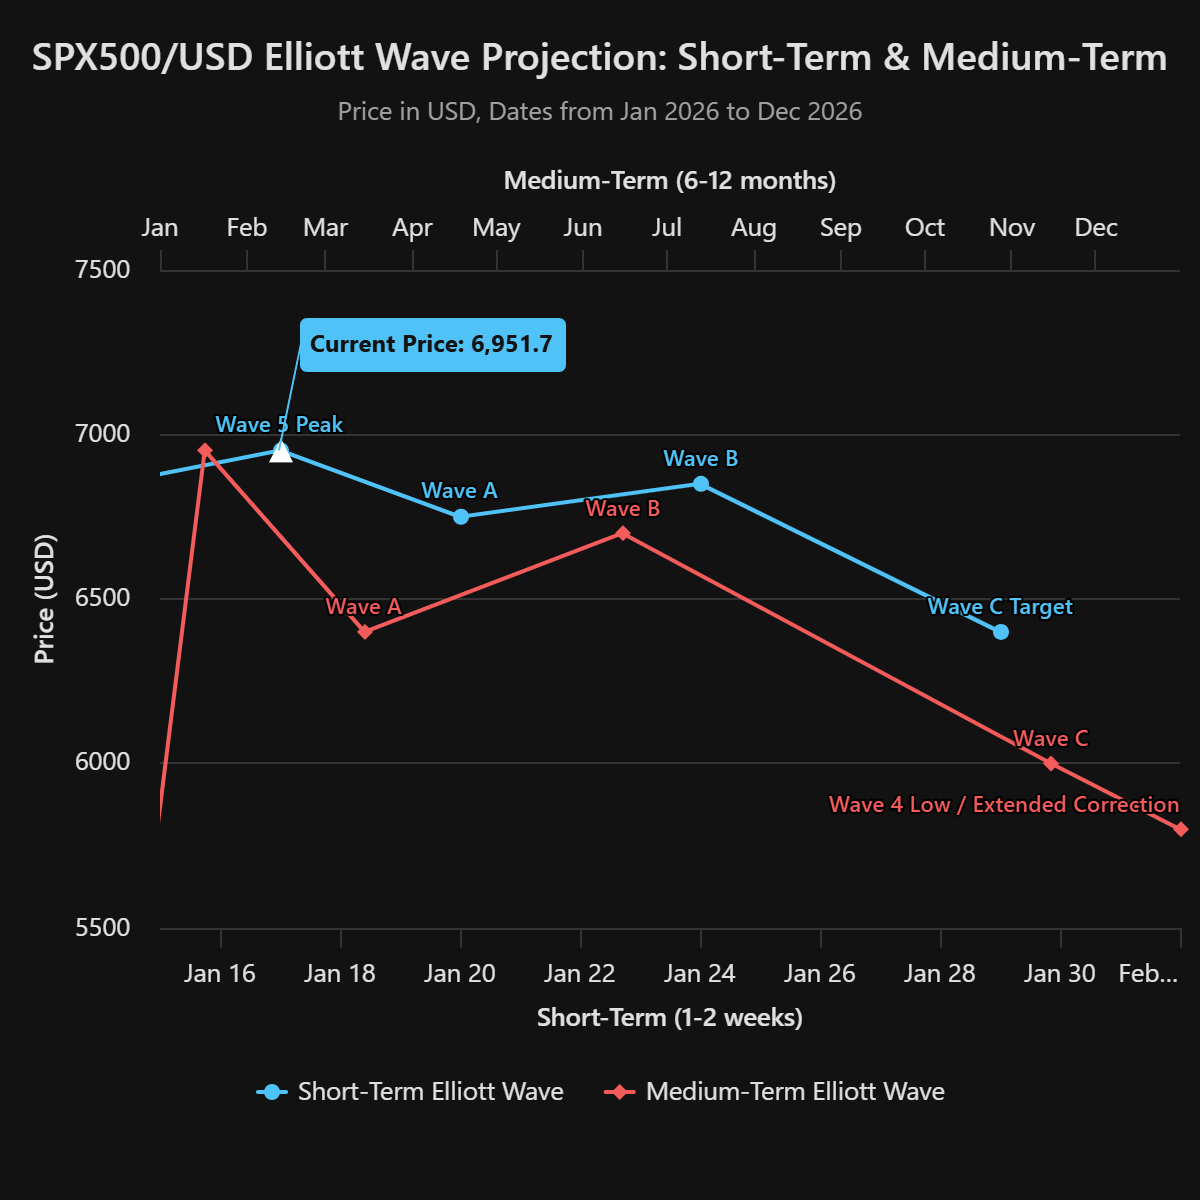
Cyclical Projections, Elliott Wave, Seasonality and may other models that actually guide decisions
Cycles, seasonality, regression, structure and “today vs future” views across thousands of symbols.
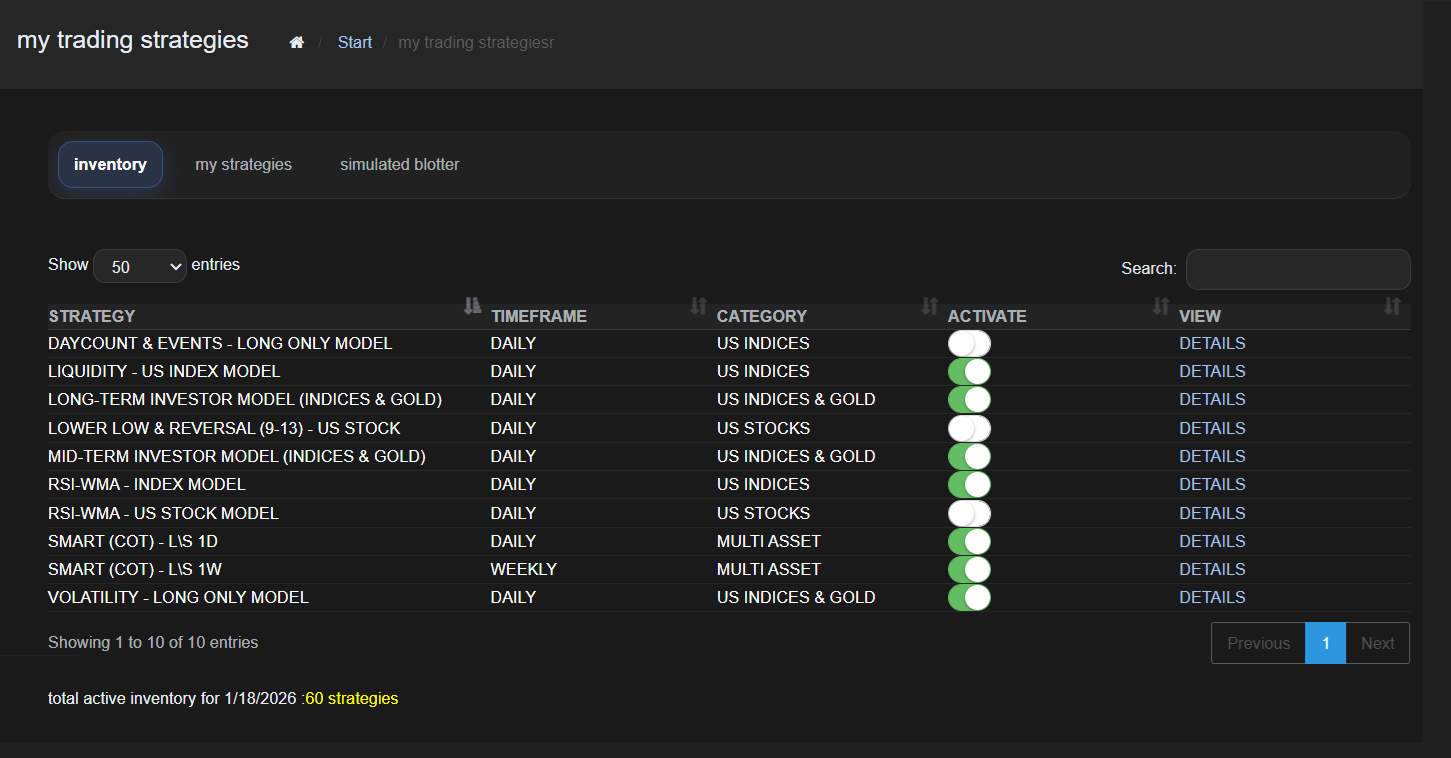
Institutional-style context (simplified)
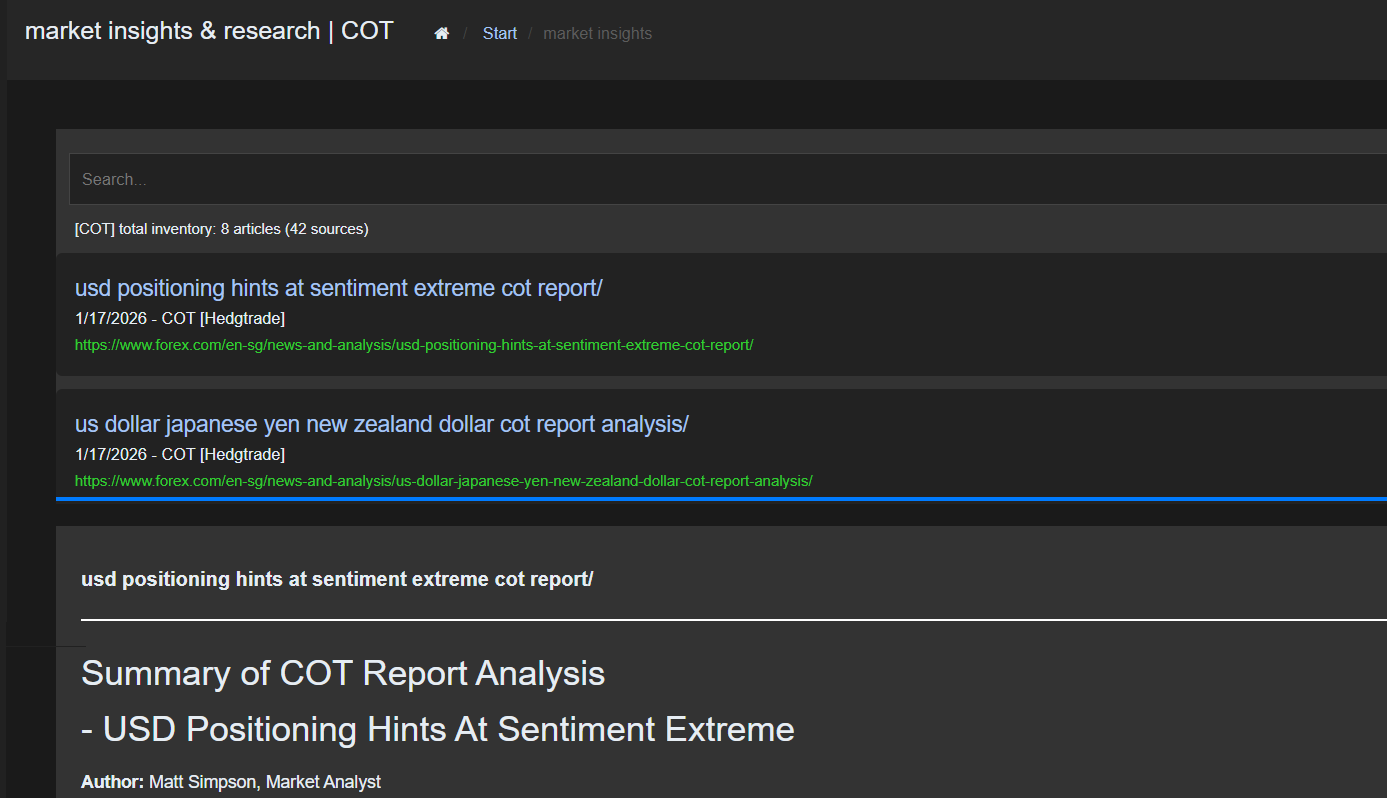
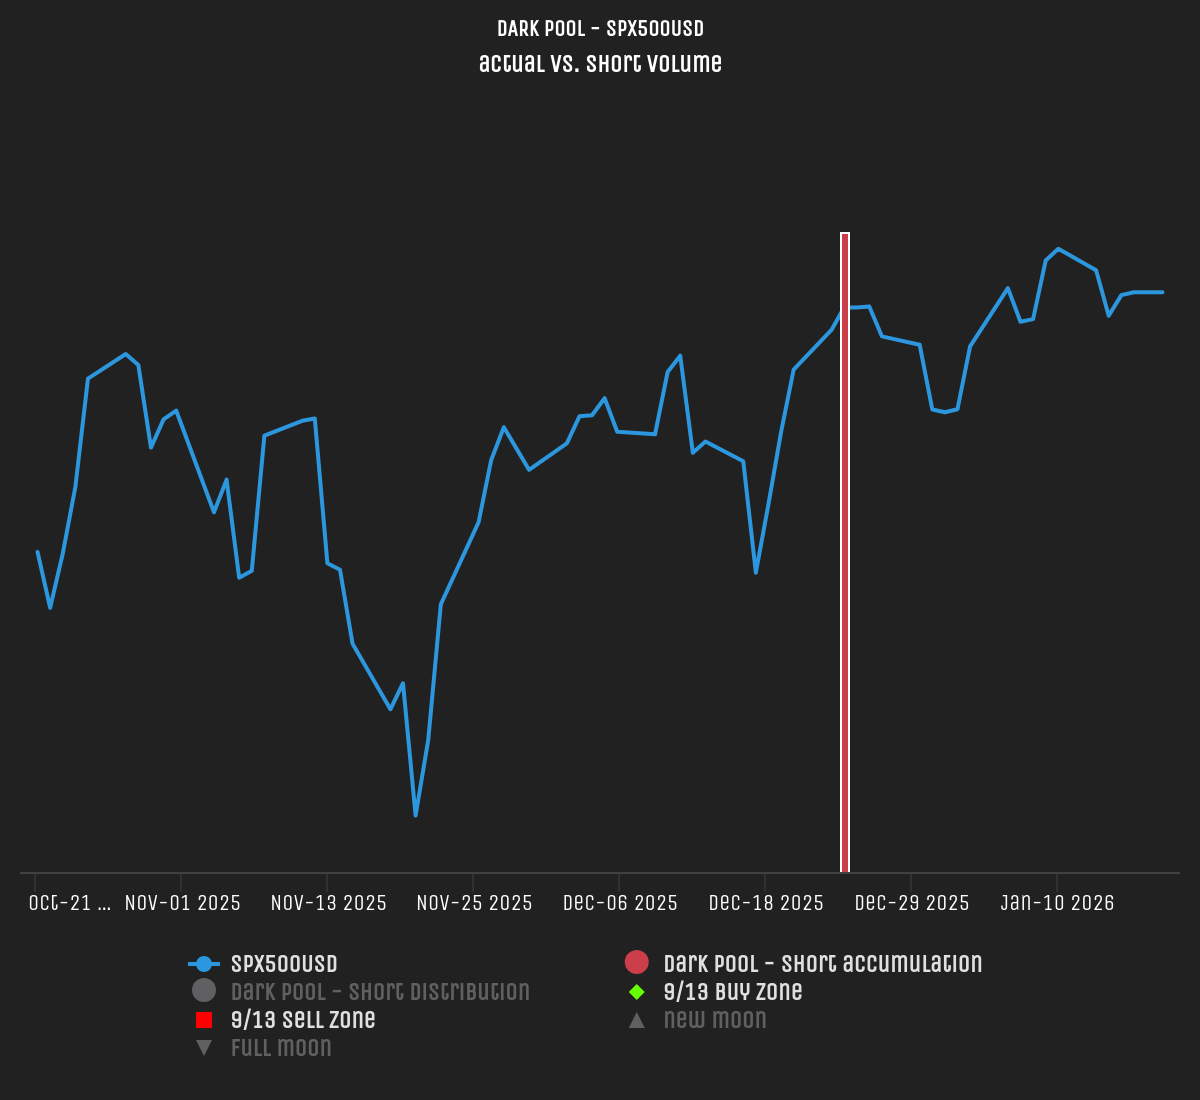
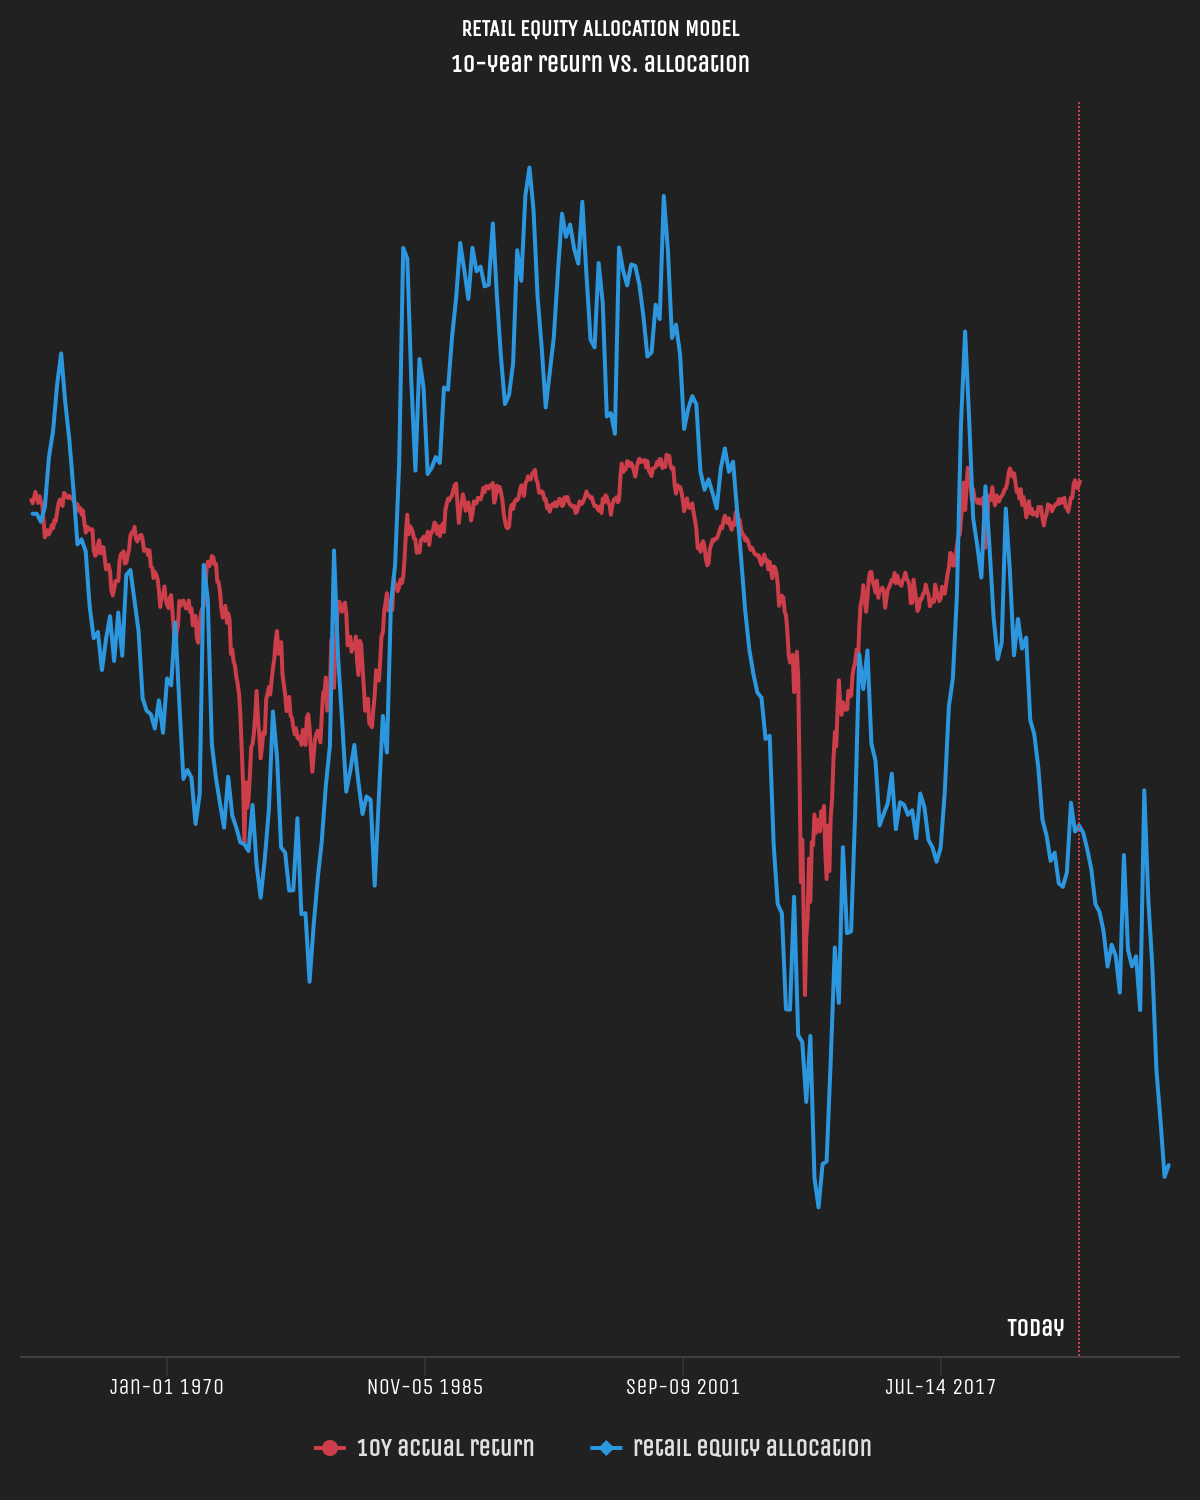
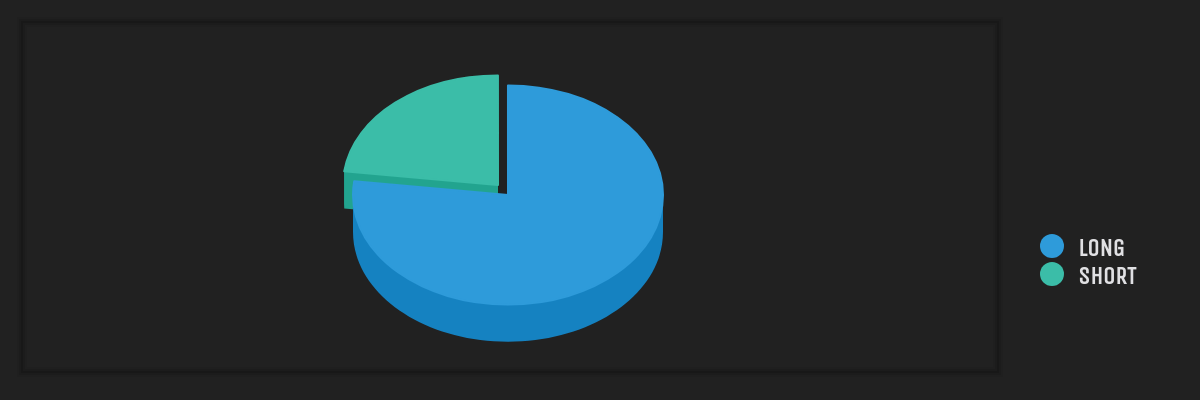
Positioning & flows (COT, Gamma, Liquidity, Sentiment) so you can tell the difference between noise & signal.
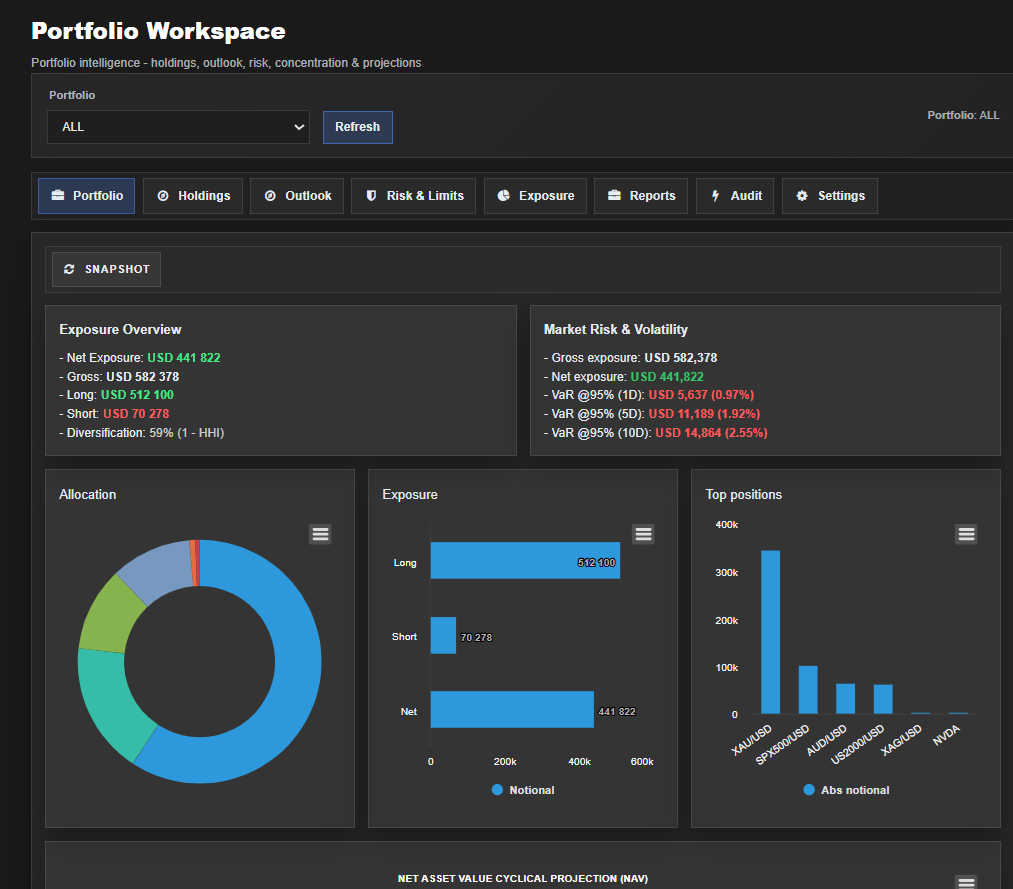
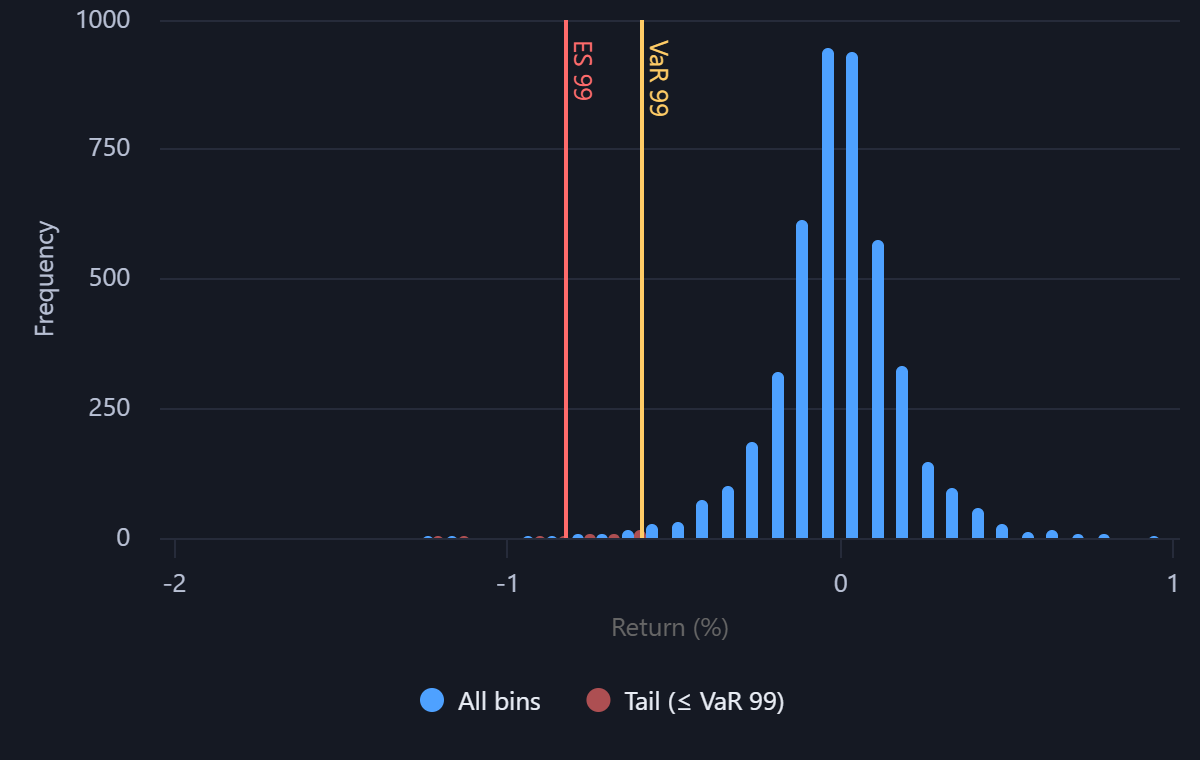
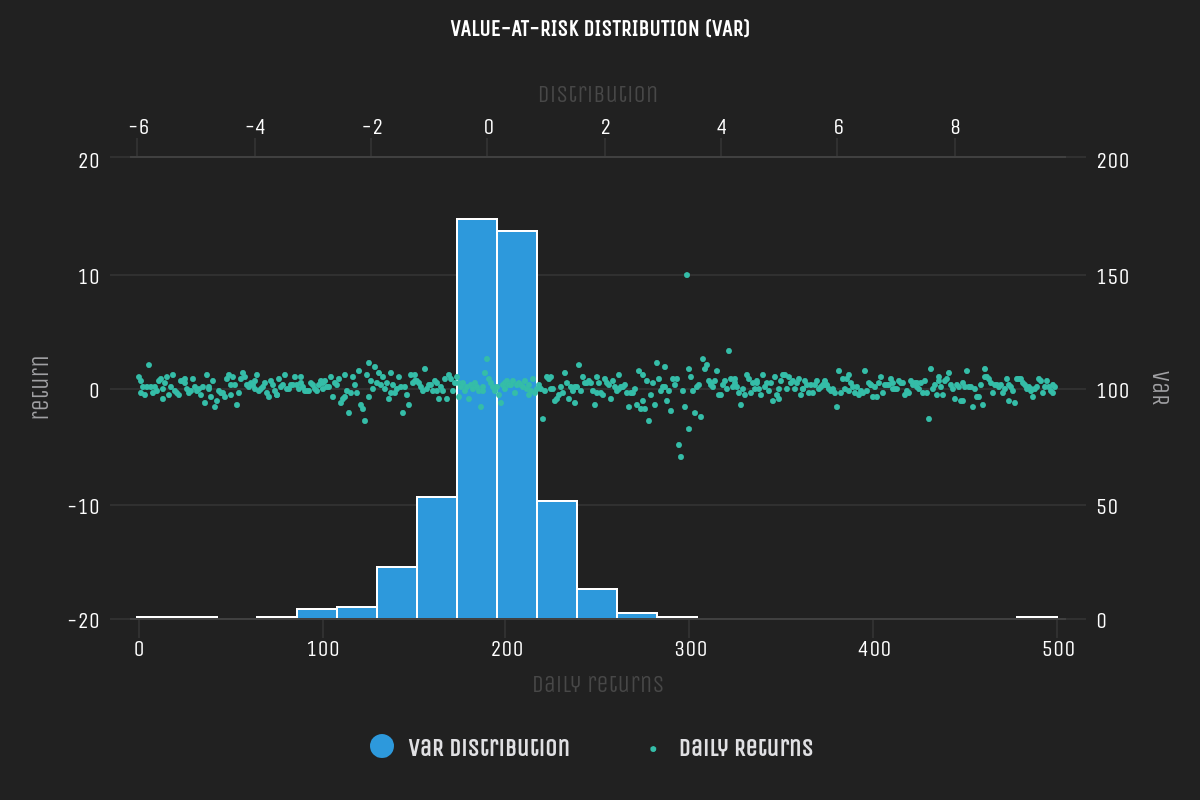
Risk and highly visial views you can act on
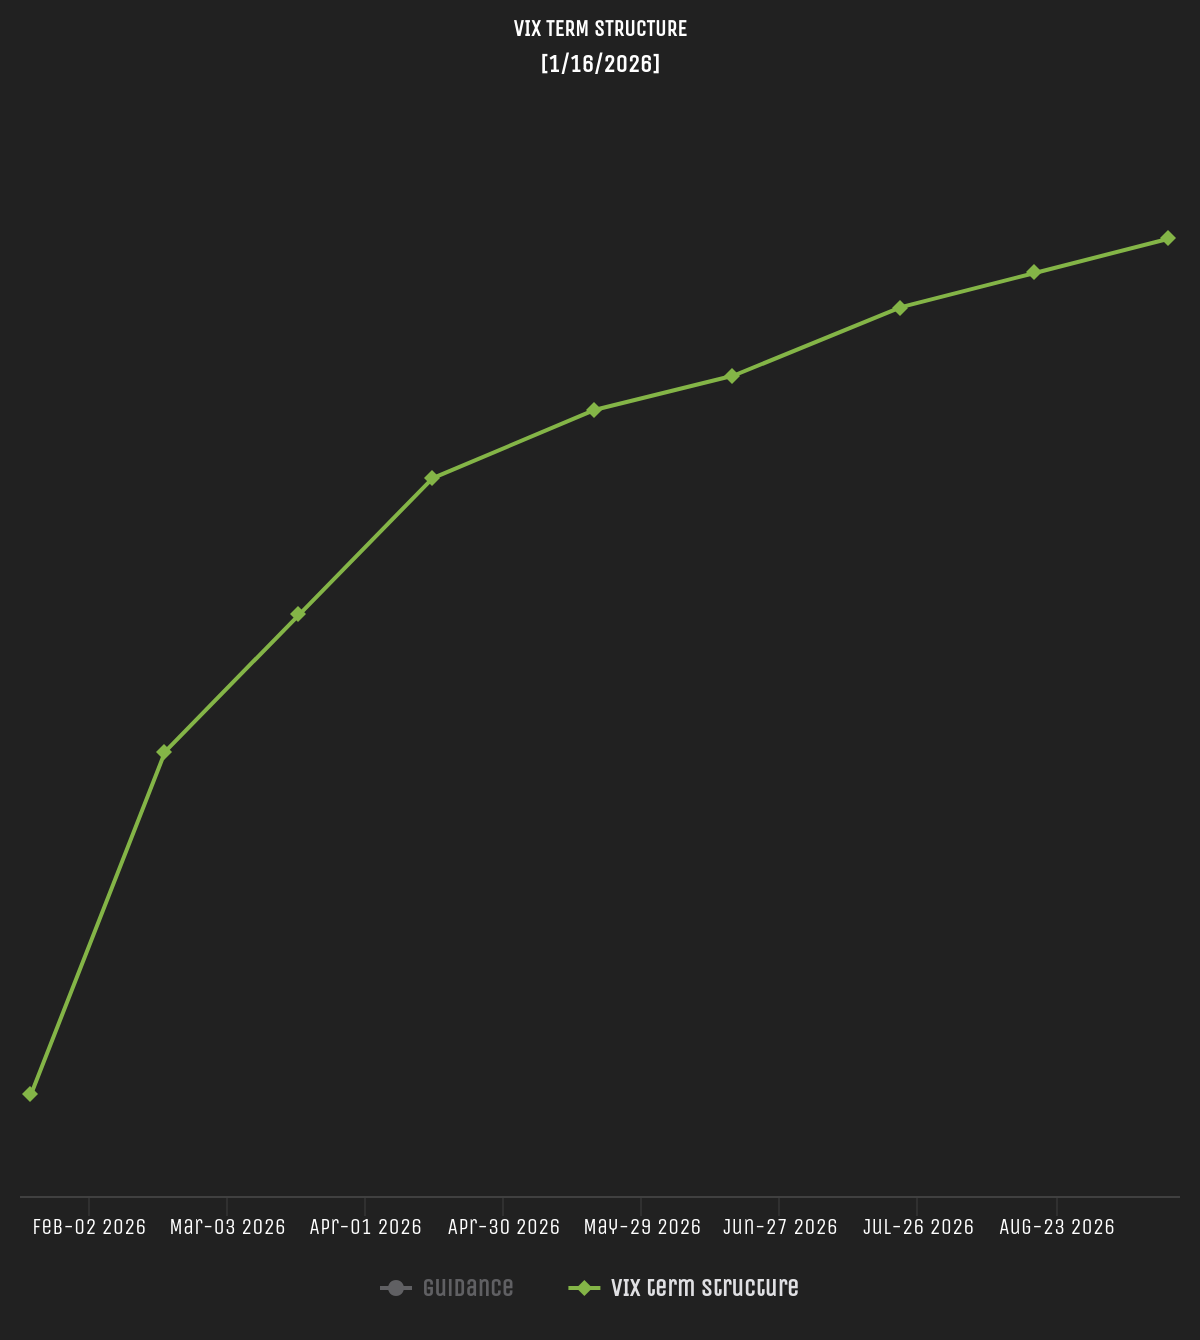
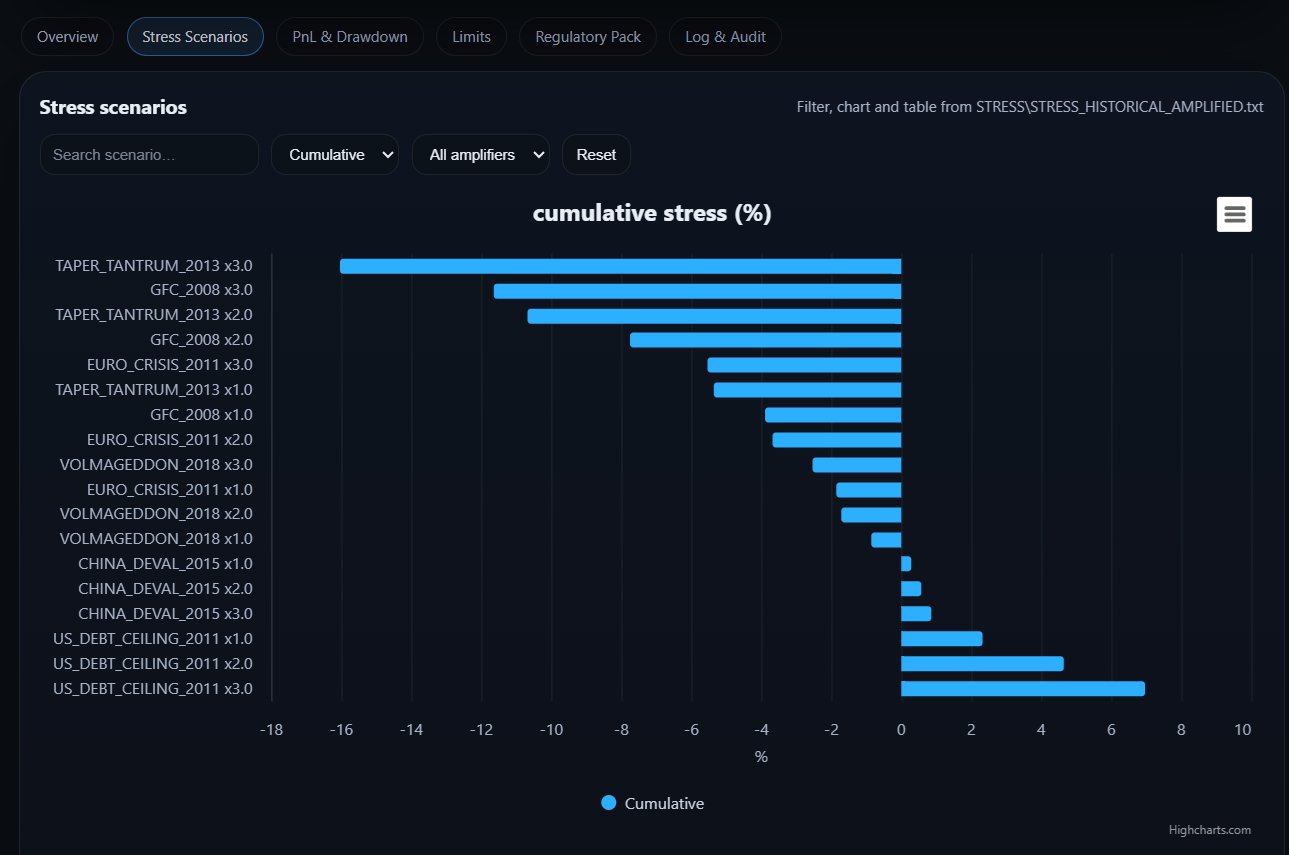
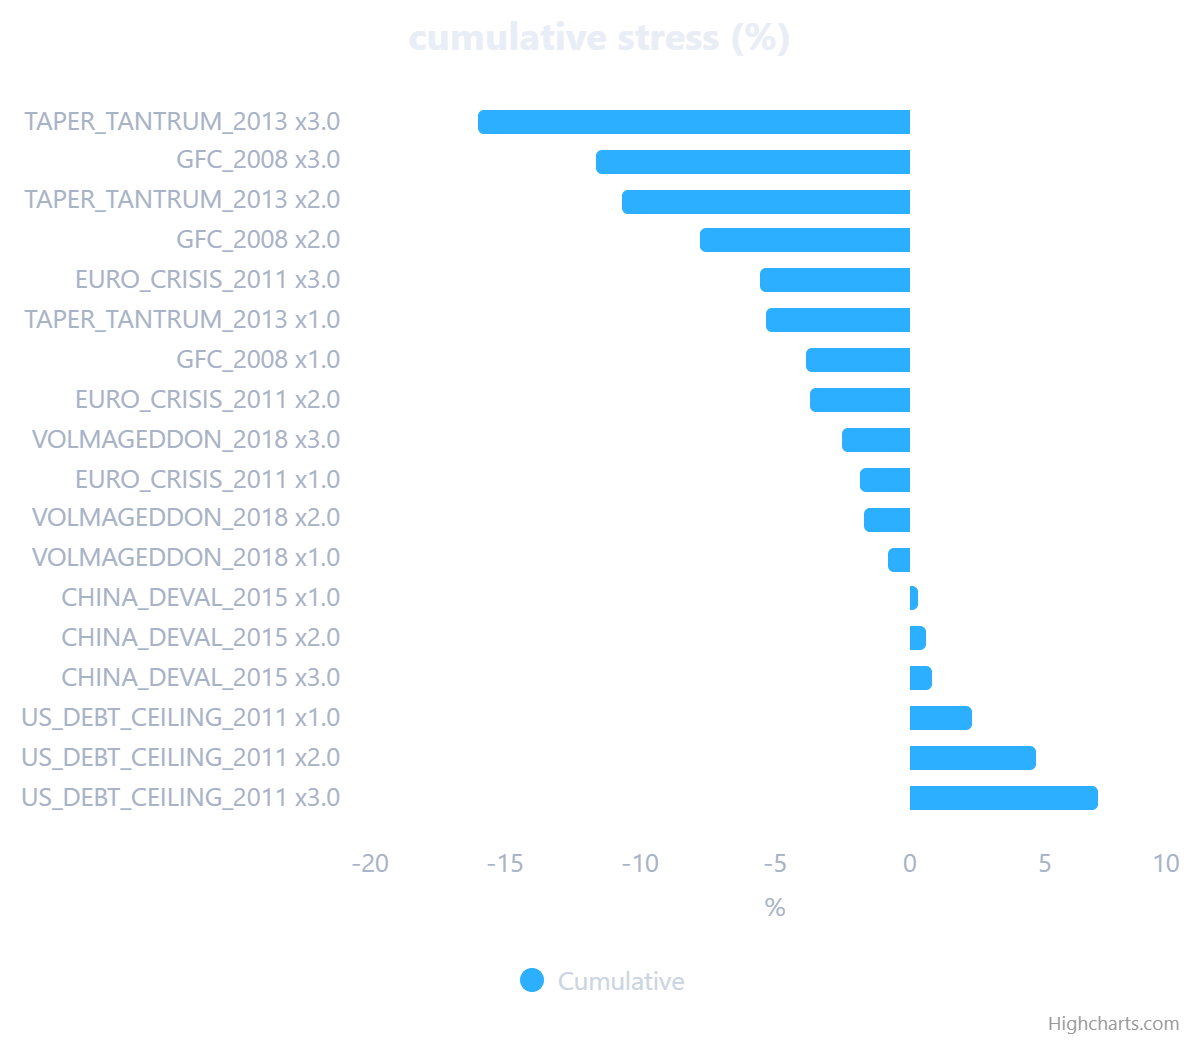
Volatility & risk signals, VaR/stress distribution views — for sizing and protecting risk at a portfolio level.
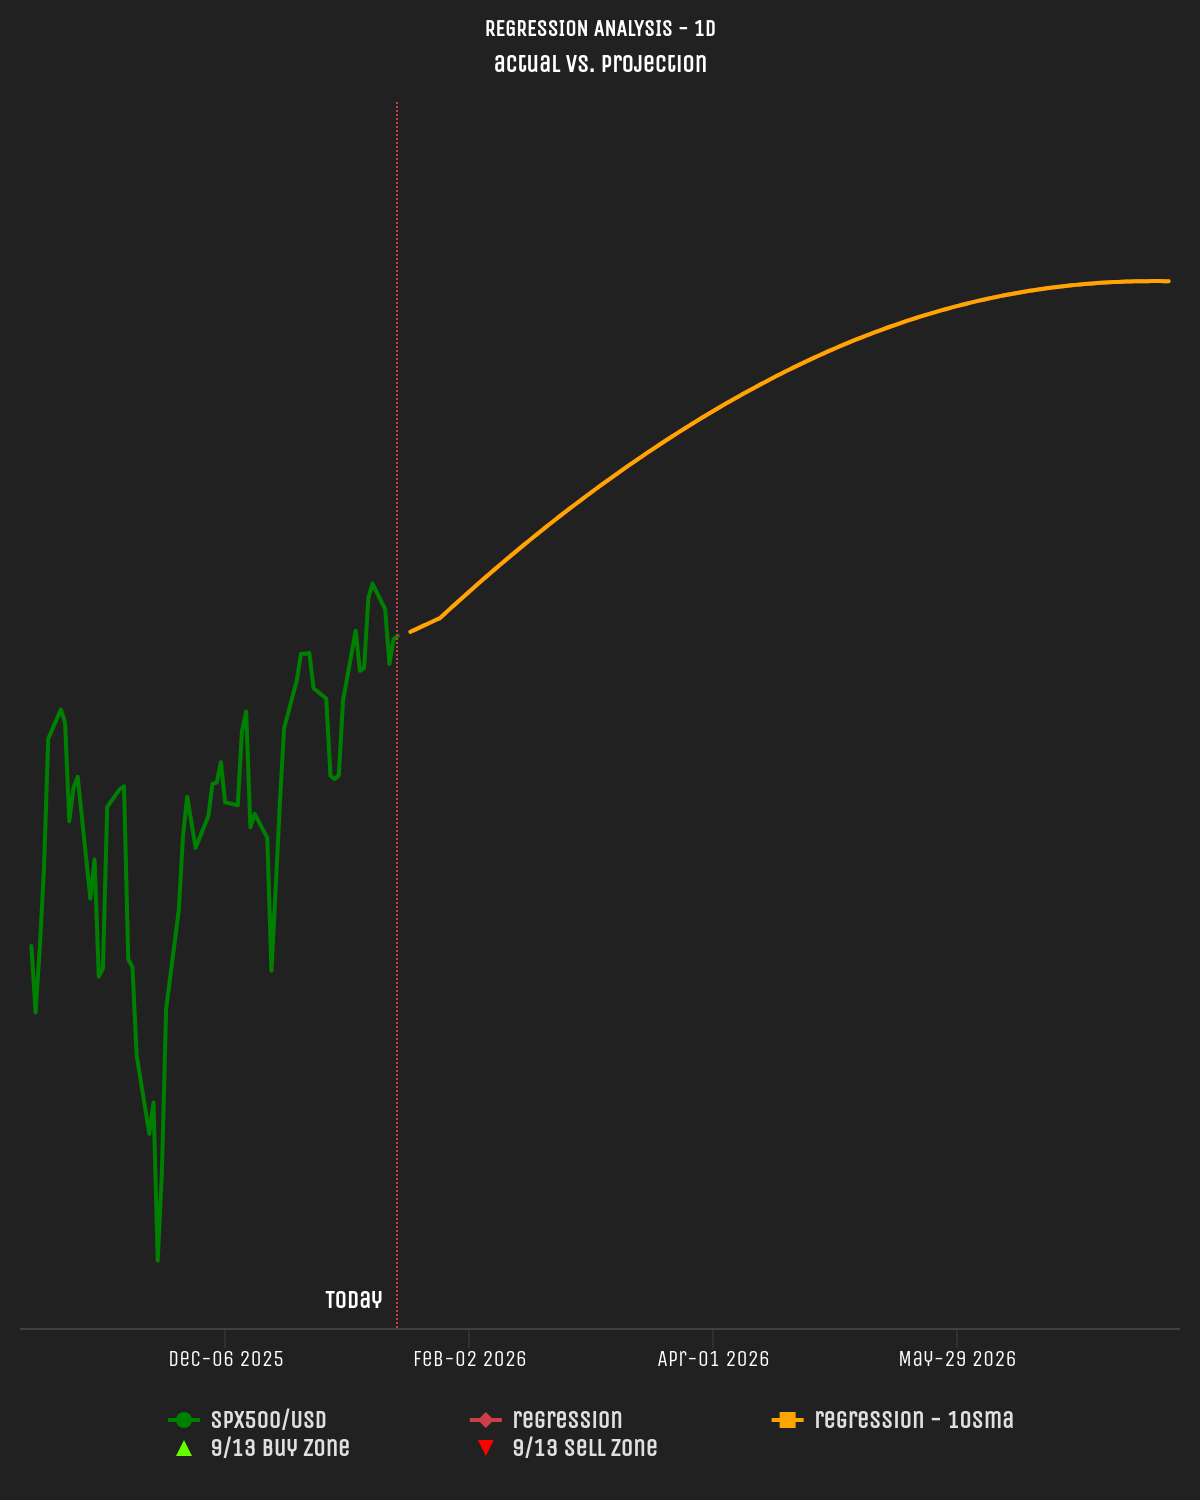
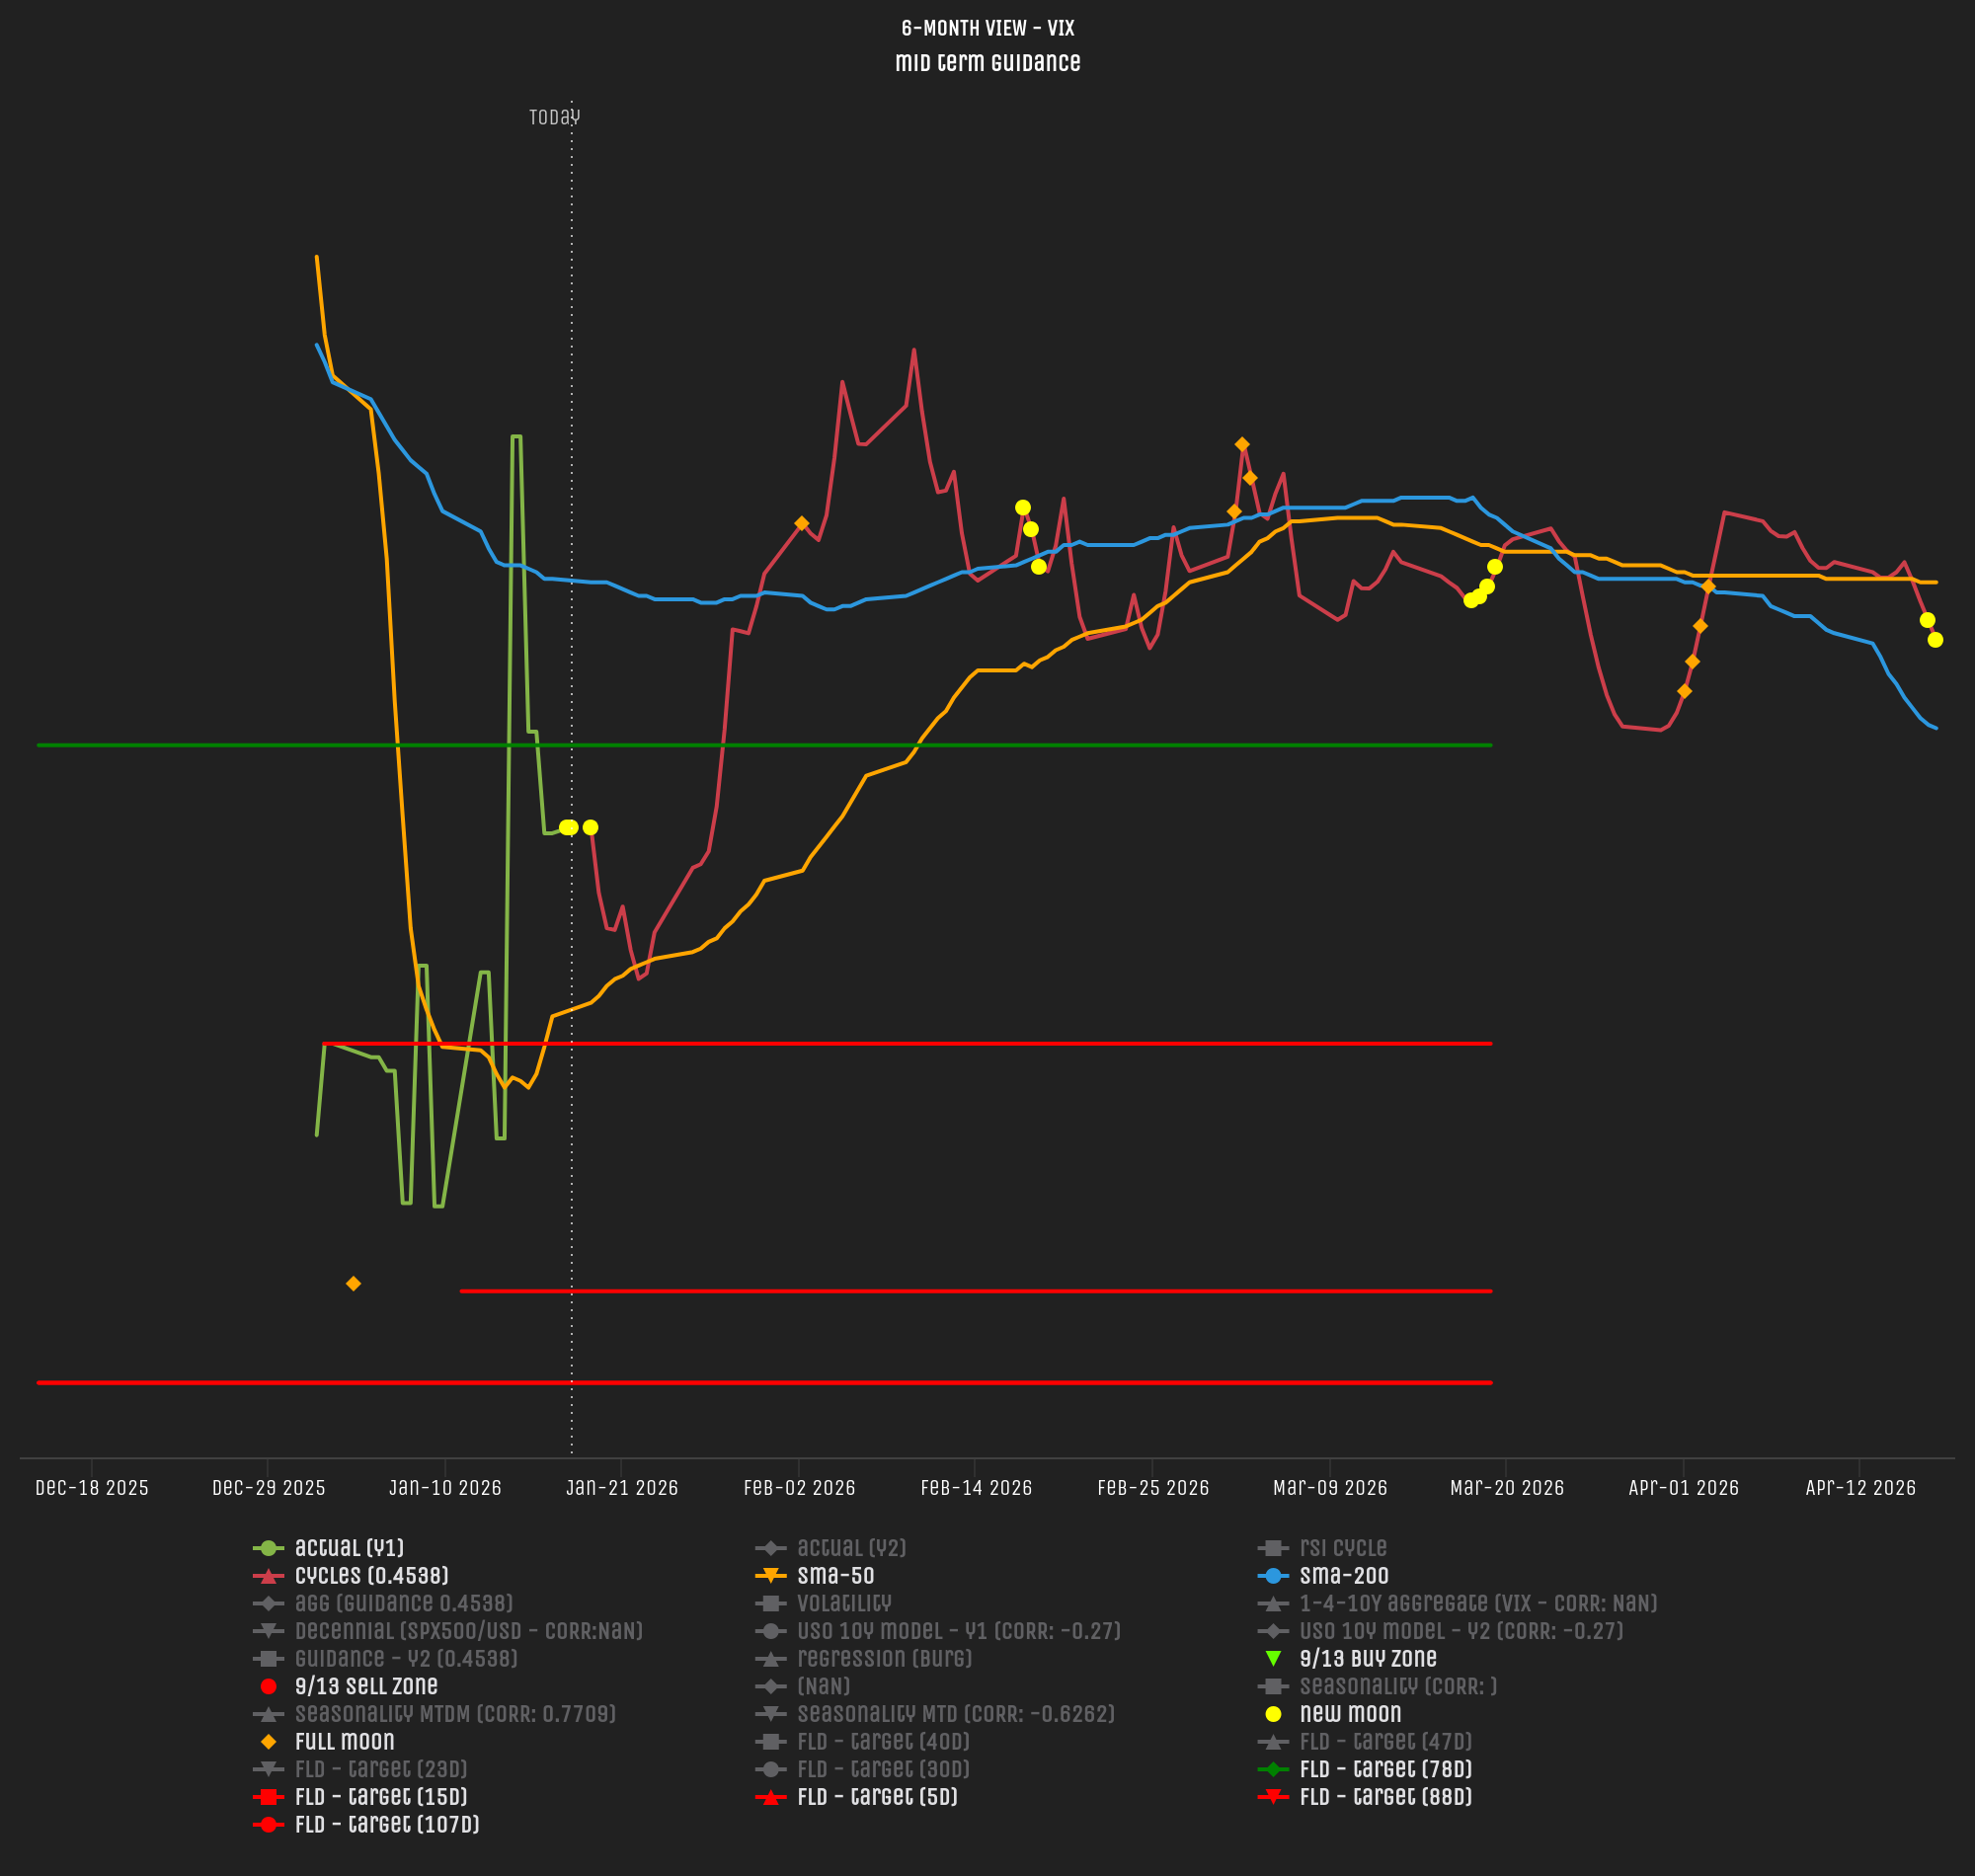
Projections & scenarios
Multi-timeframe views that keep you aligned with the bigger picture.
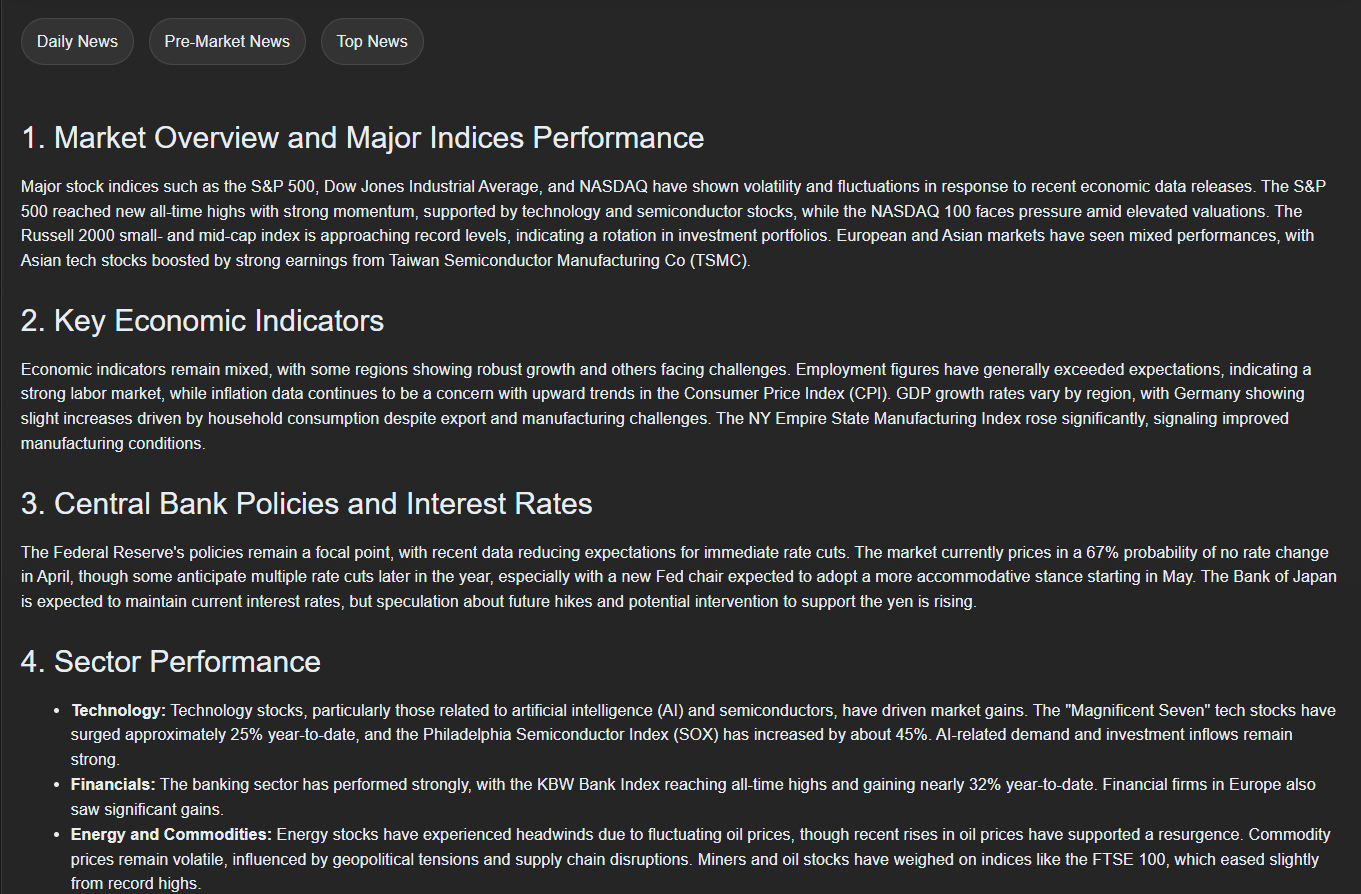
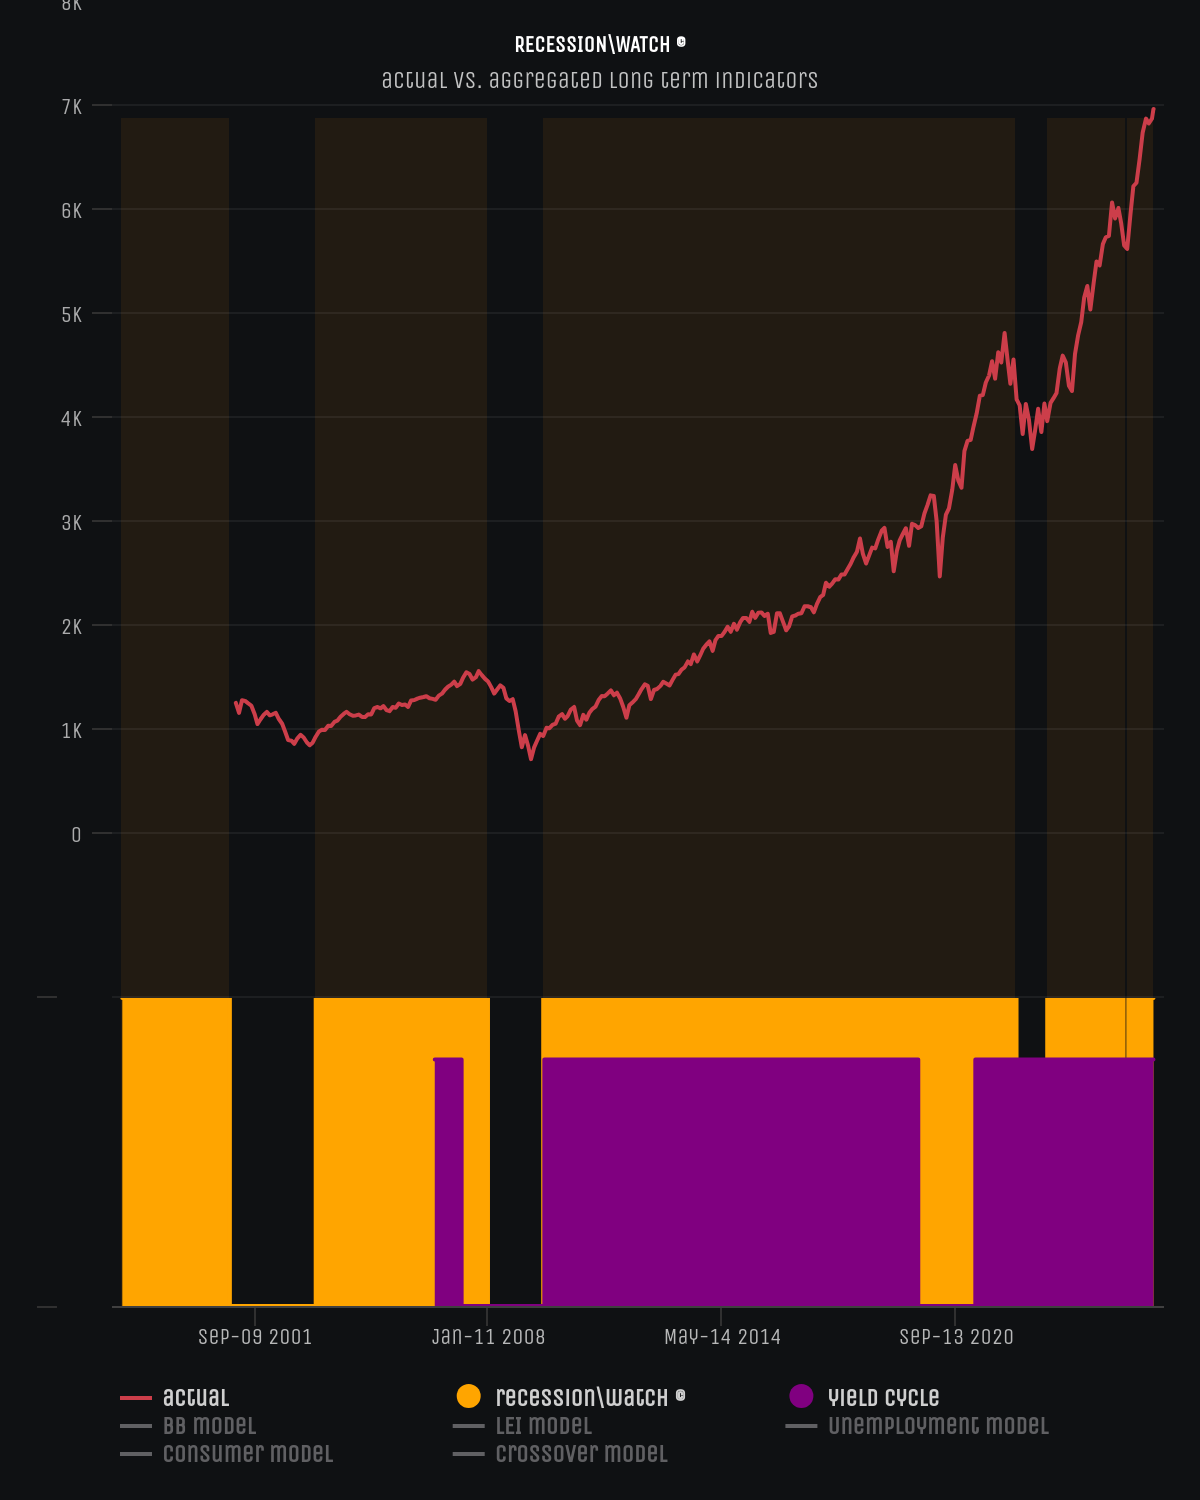
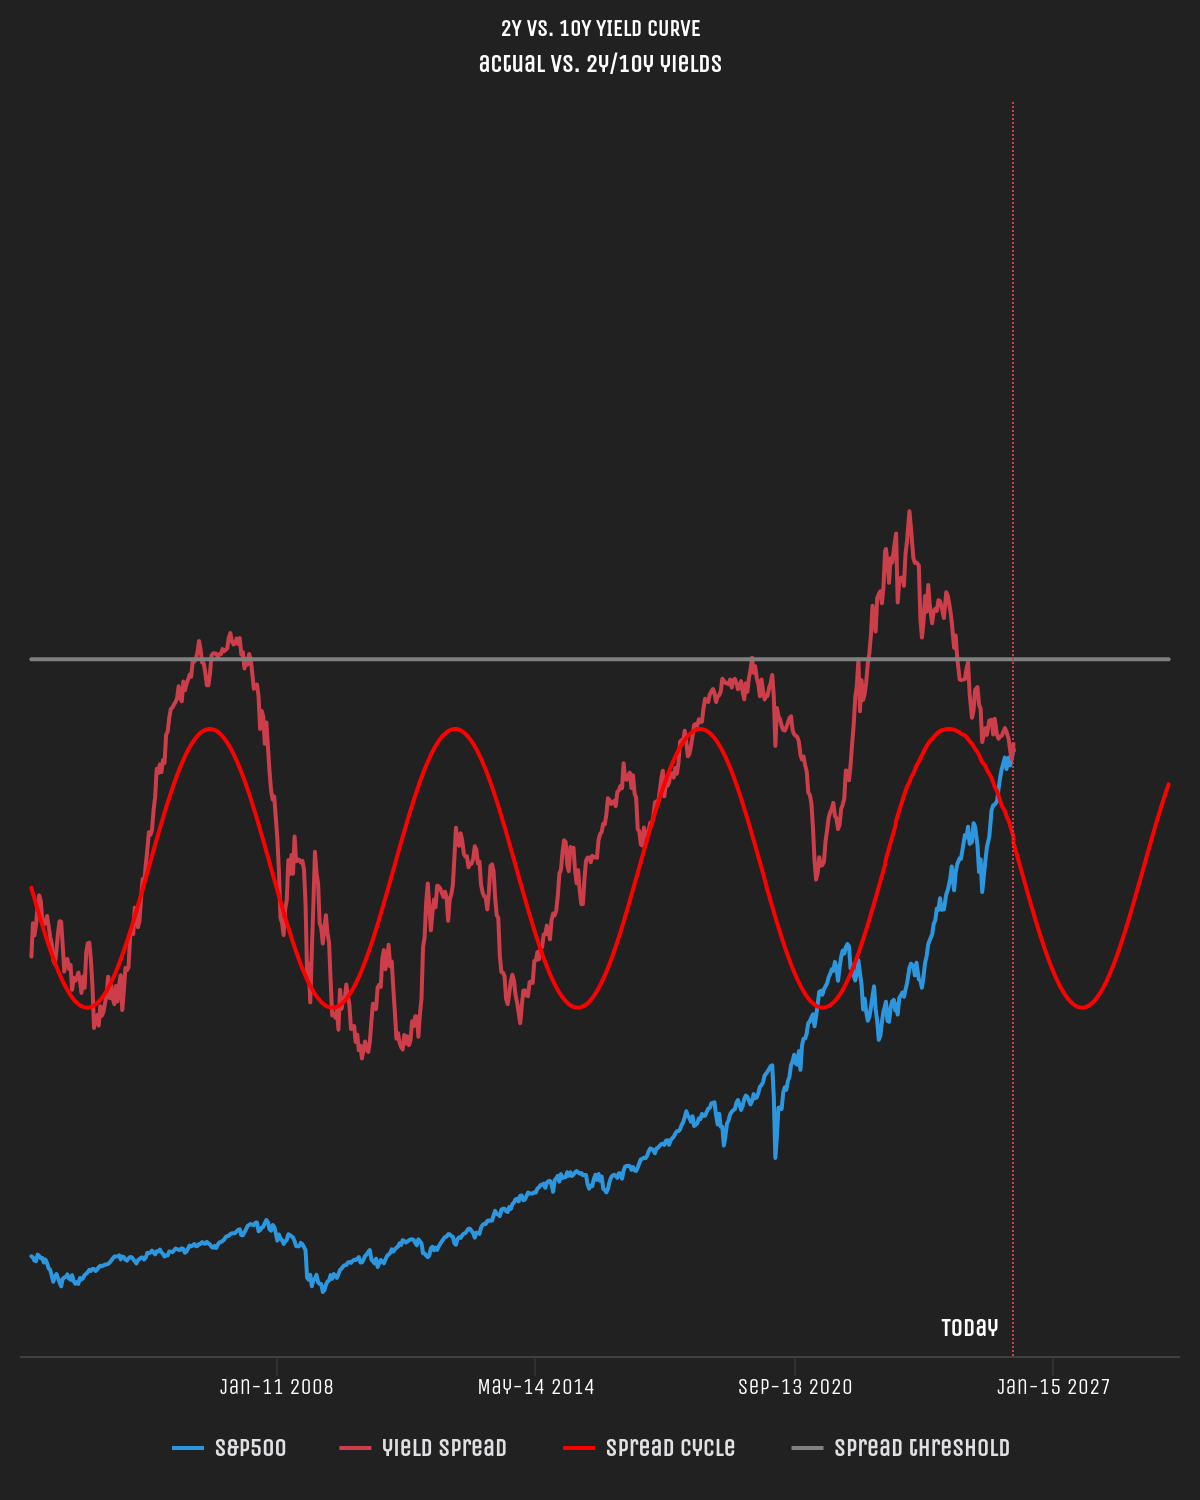
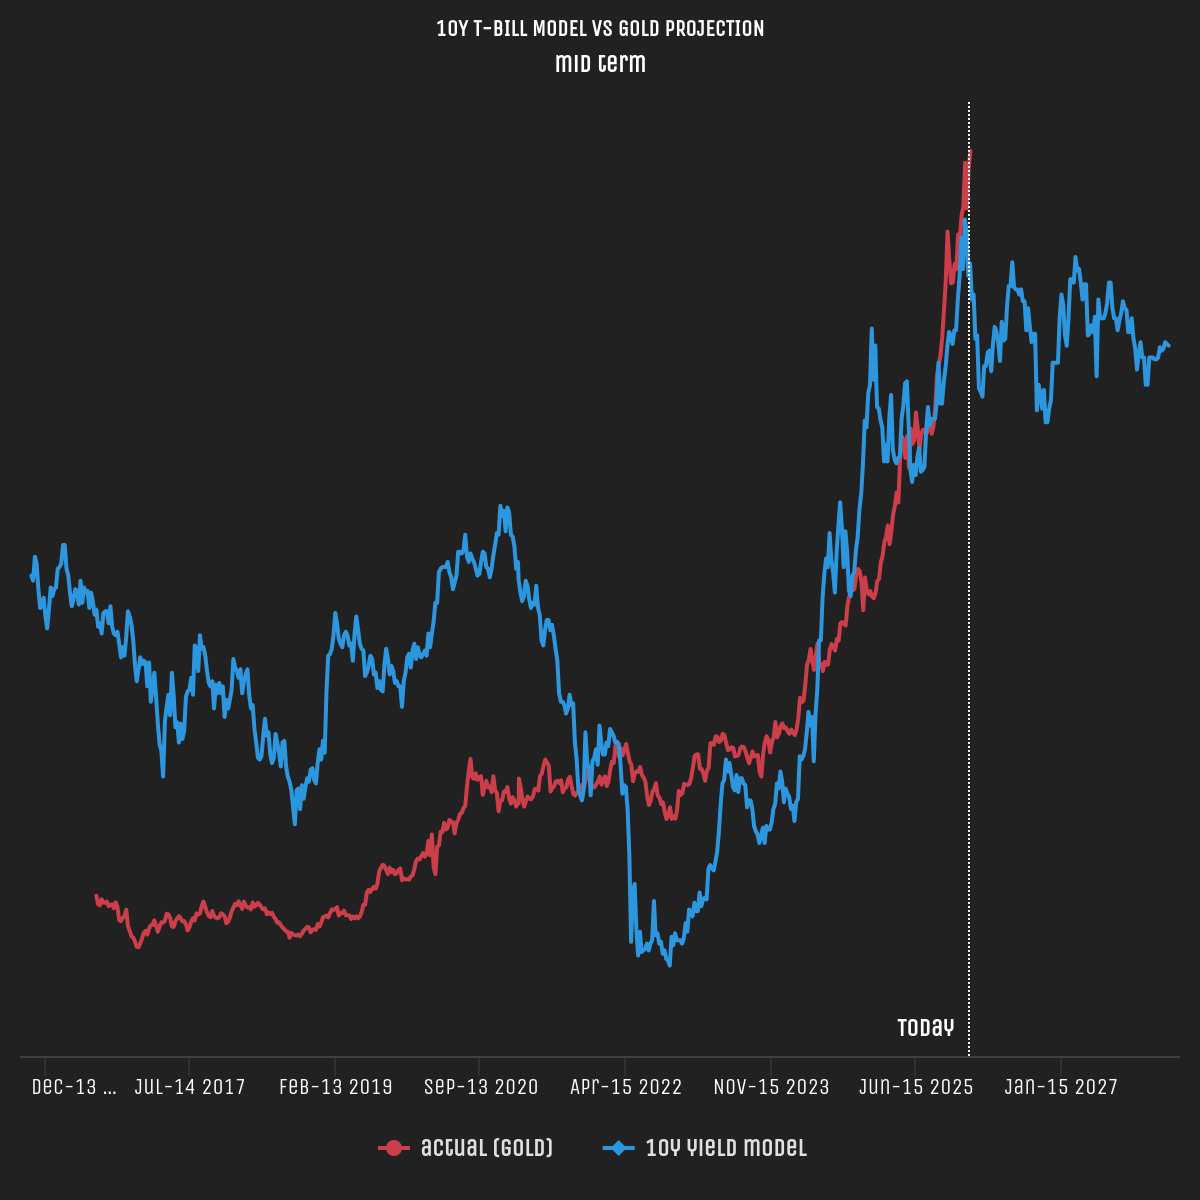
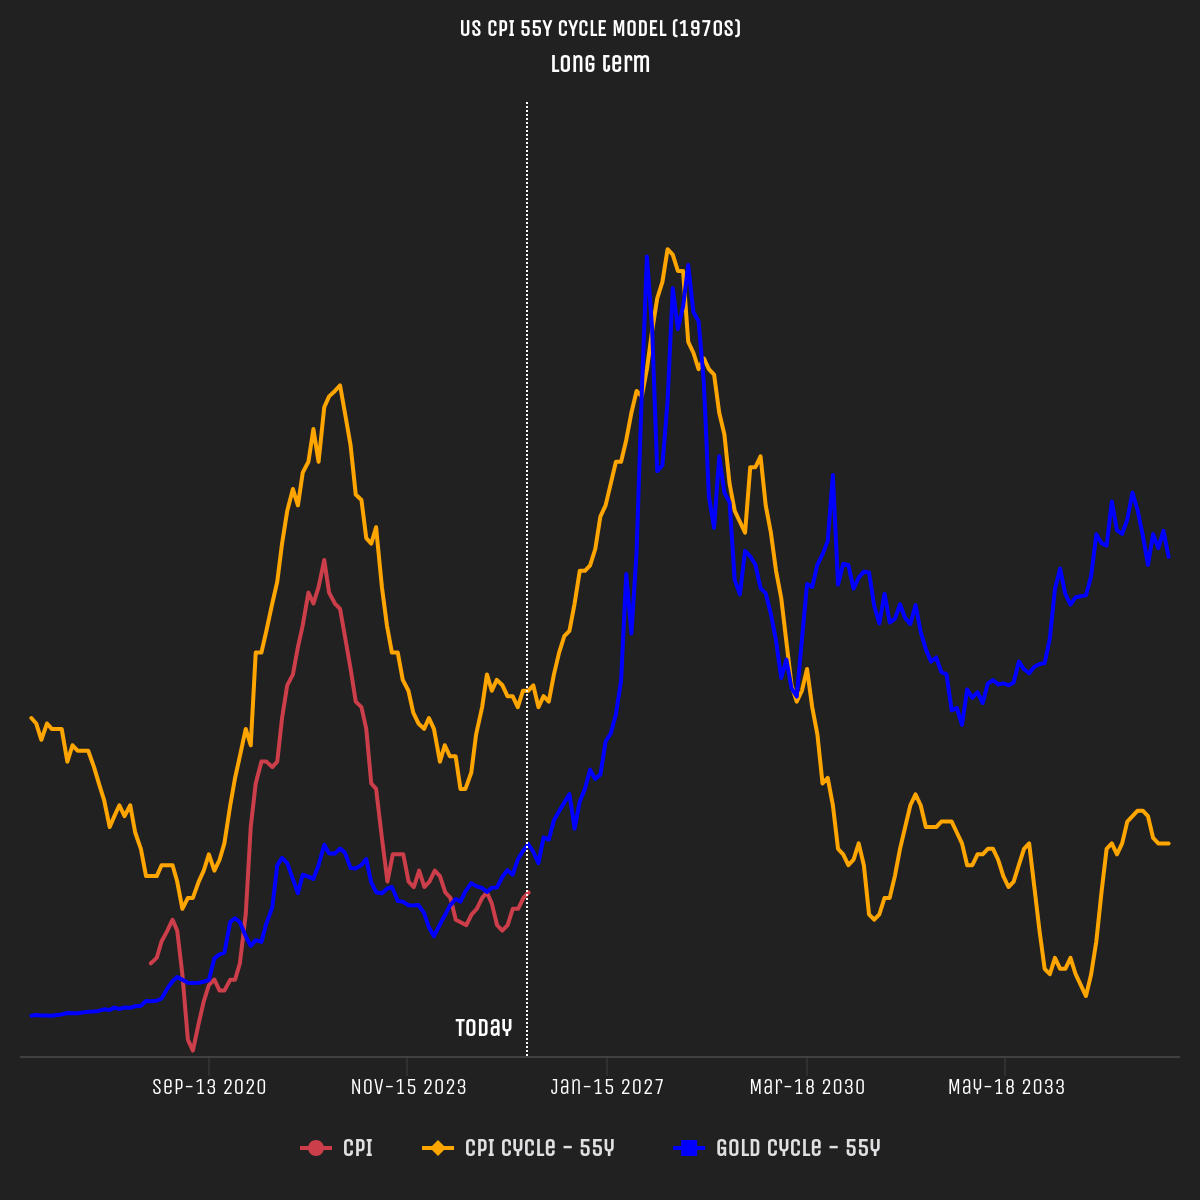
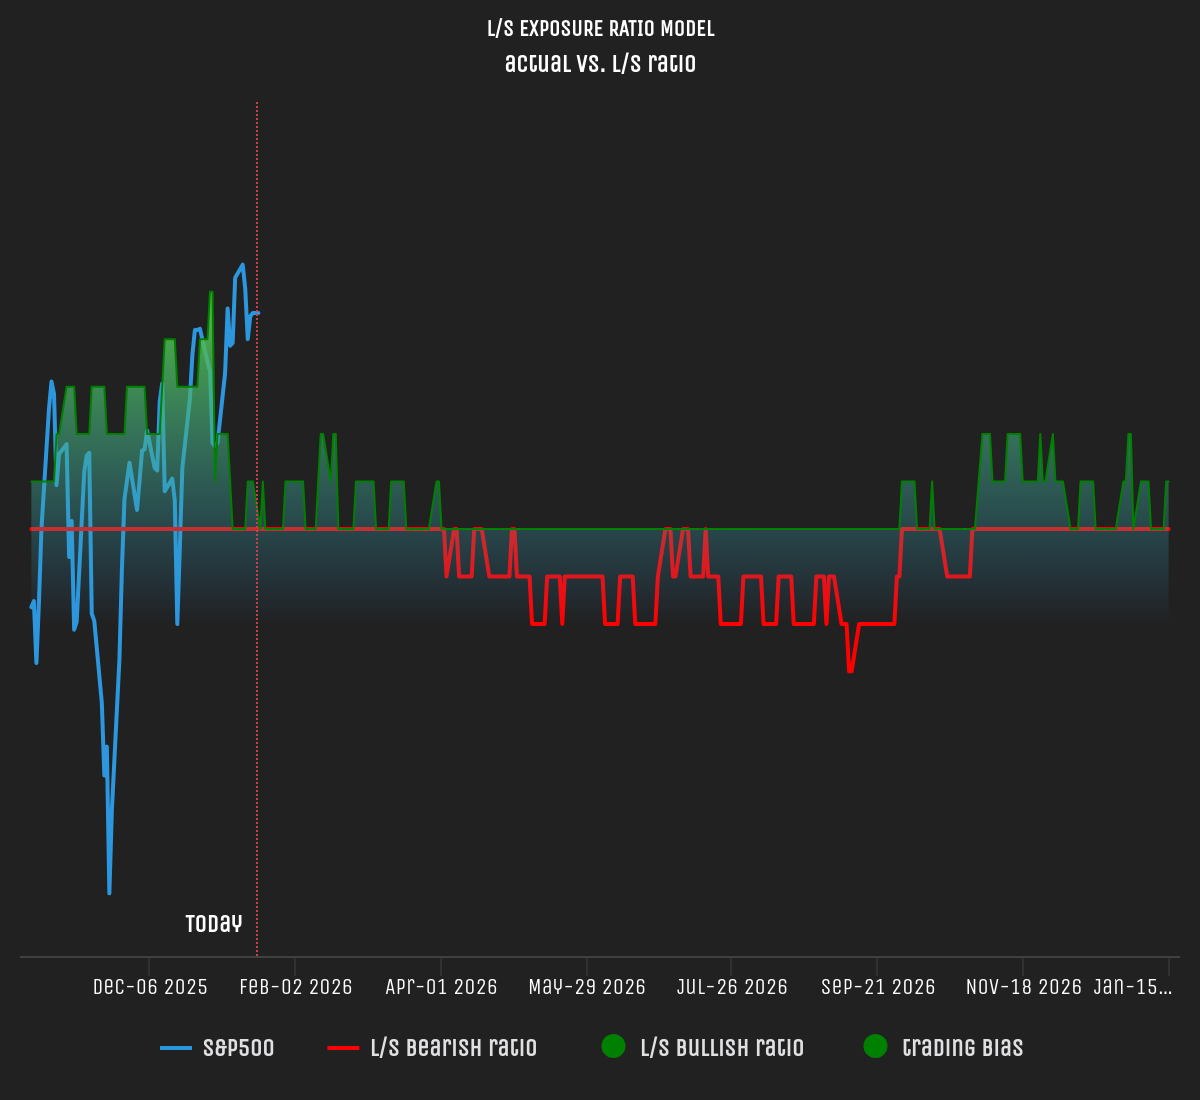
Regime & macro context
Context first: rates, volatility, curve signals and recession risk.
Positioning & flows
Institutional-style context made usable for retail decision-making.
.png)
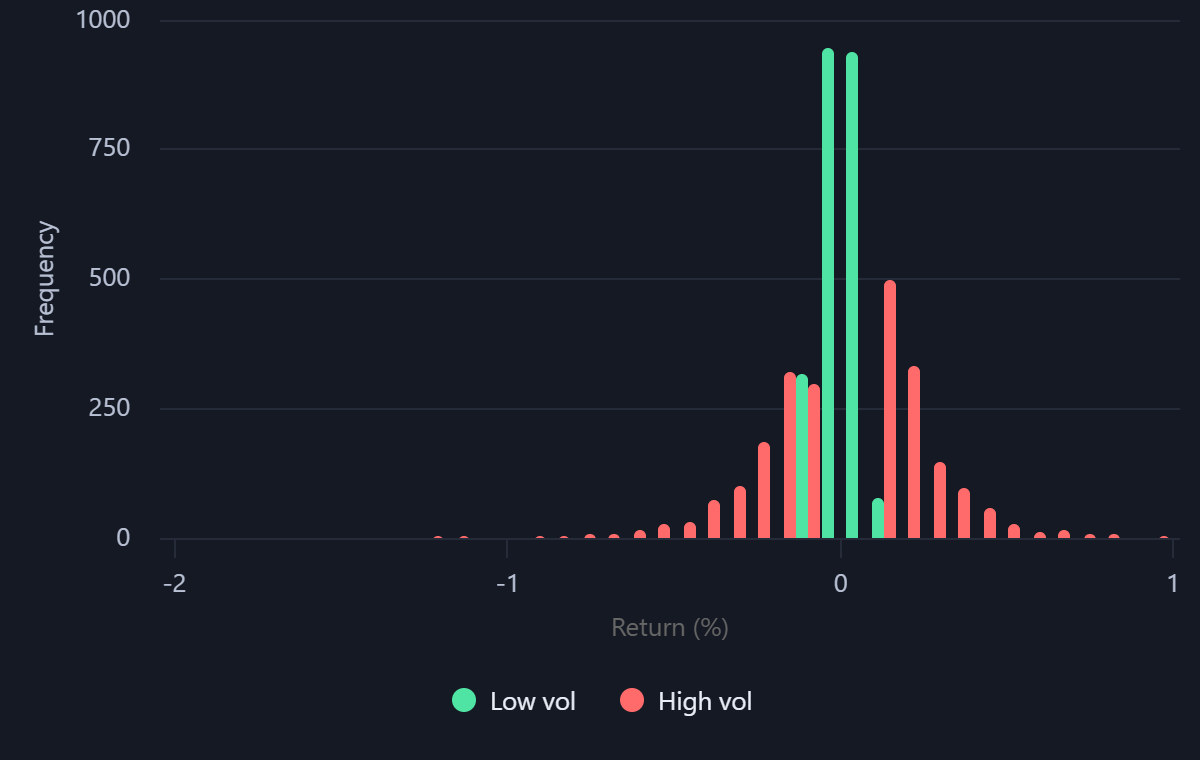
Risk control
Sizing and protection tools that support disciplined execution.
.png)
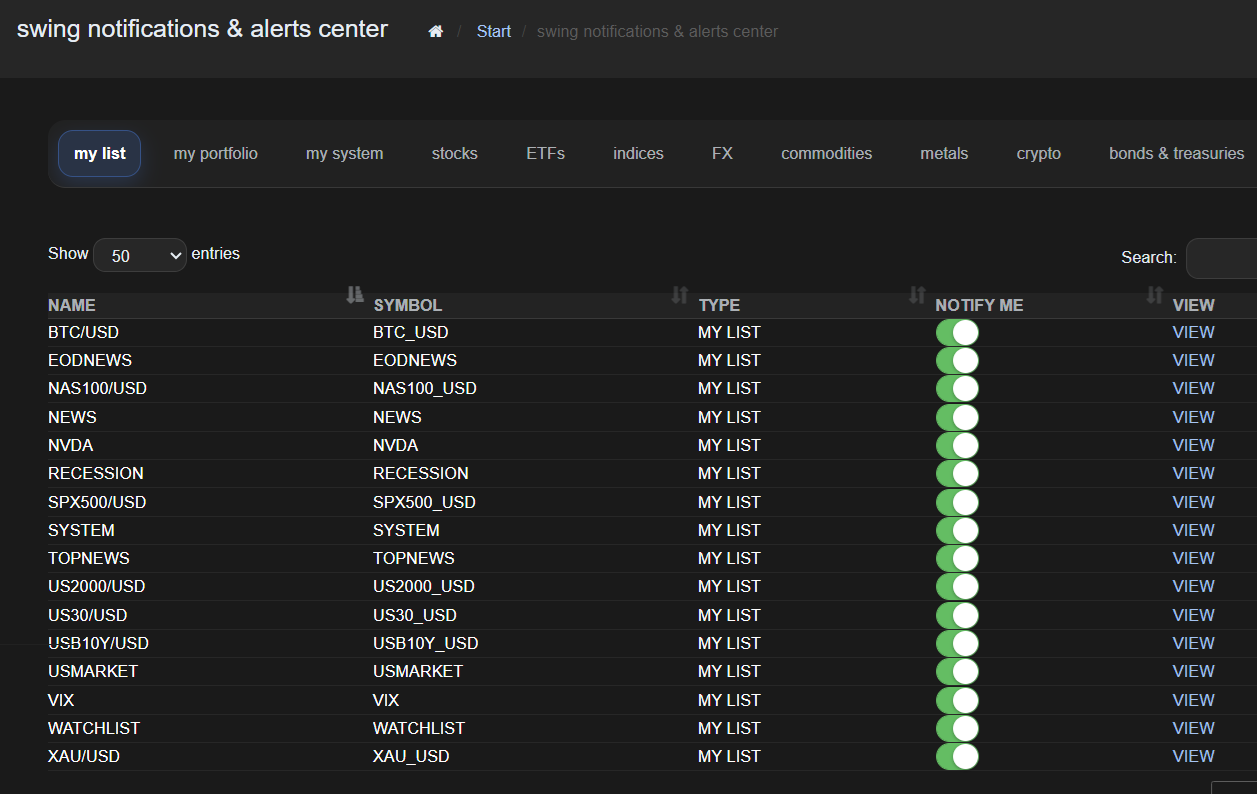
Workflow, alerts & research
The daily operating system: brief + alerts + copilot + research.